.png)
What Is Content Performance?
Content performance refers to measuring the impact your published content makes on your target audience as well as your business.
Marketers measure the performance of their content through different sets of metrics that we’ll go over shortly.
And the purpose is to gain insights into how aligned your content is with your target audience, learn more about your customers, and understand whether your content is driving business results.
Why Is Content Performance Important?
Content performance analysis is a key part of your content marketing efforts.
Implementing a content strategy can take a lot of effort, time, and money. So, you want to make sure your content is generating your desired results.
Diving deep into content marketing performance metrics lets you:
- Find ways to improve and optimize your content
- Make better decisions based on the data you collect
- Allocate your resources better
- Advocate for leadership buy-in for further investments into content marketing
Key Content Marketing Performance Metrics to Track
Let’s explore 19 content performance metrics to measure for better results.
User Behavior Metrics
User behavior metrics help you understand visitors’ behavior on your website or app.
Views
Views represent the number of total visits your website or app got within a specific time frame.
They refer to visits from all sources. Like organic (unpaid) search, social media, email, referrals from other websites, and more.
This metric helps you understand which content formats and pieces are most popular among your audience. And they also allow you to identify the ones that are the least popular.
This information can inform your content strategy in the future. For example, you can choose to create more content about the topics that gain the most attention.
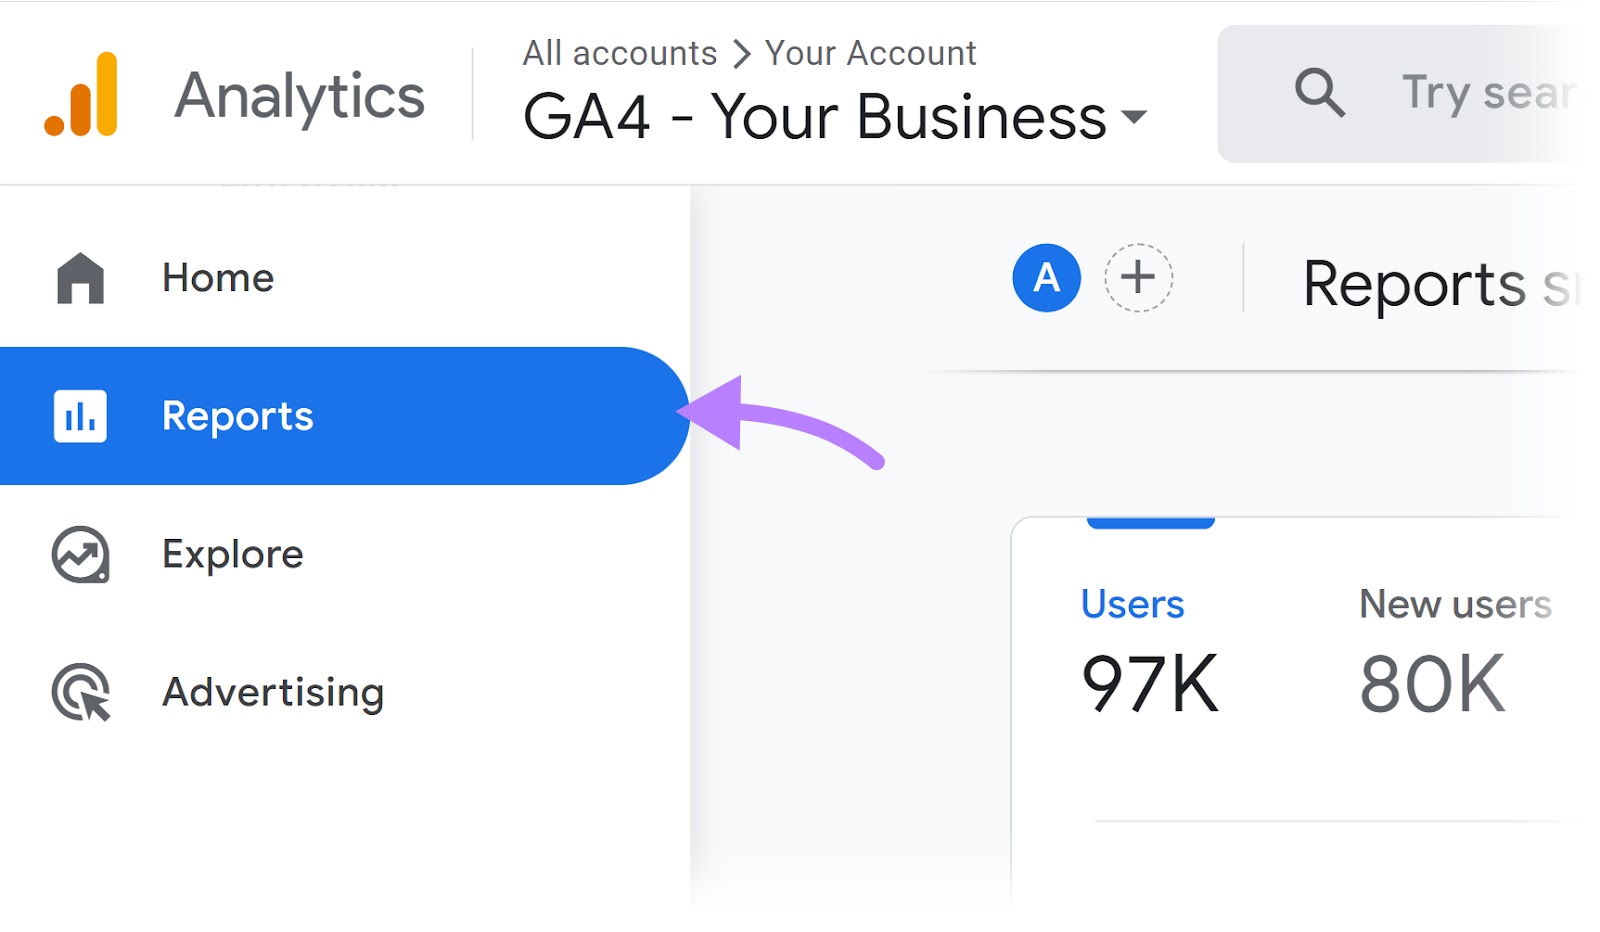
Track your website views in Google Analytics 4 (GA4). Here’s how:
Click “Reports” in the menu on the left.
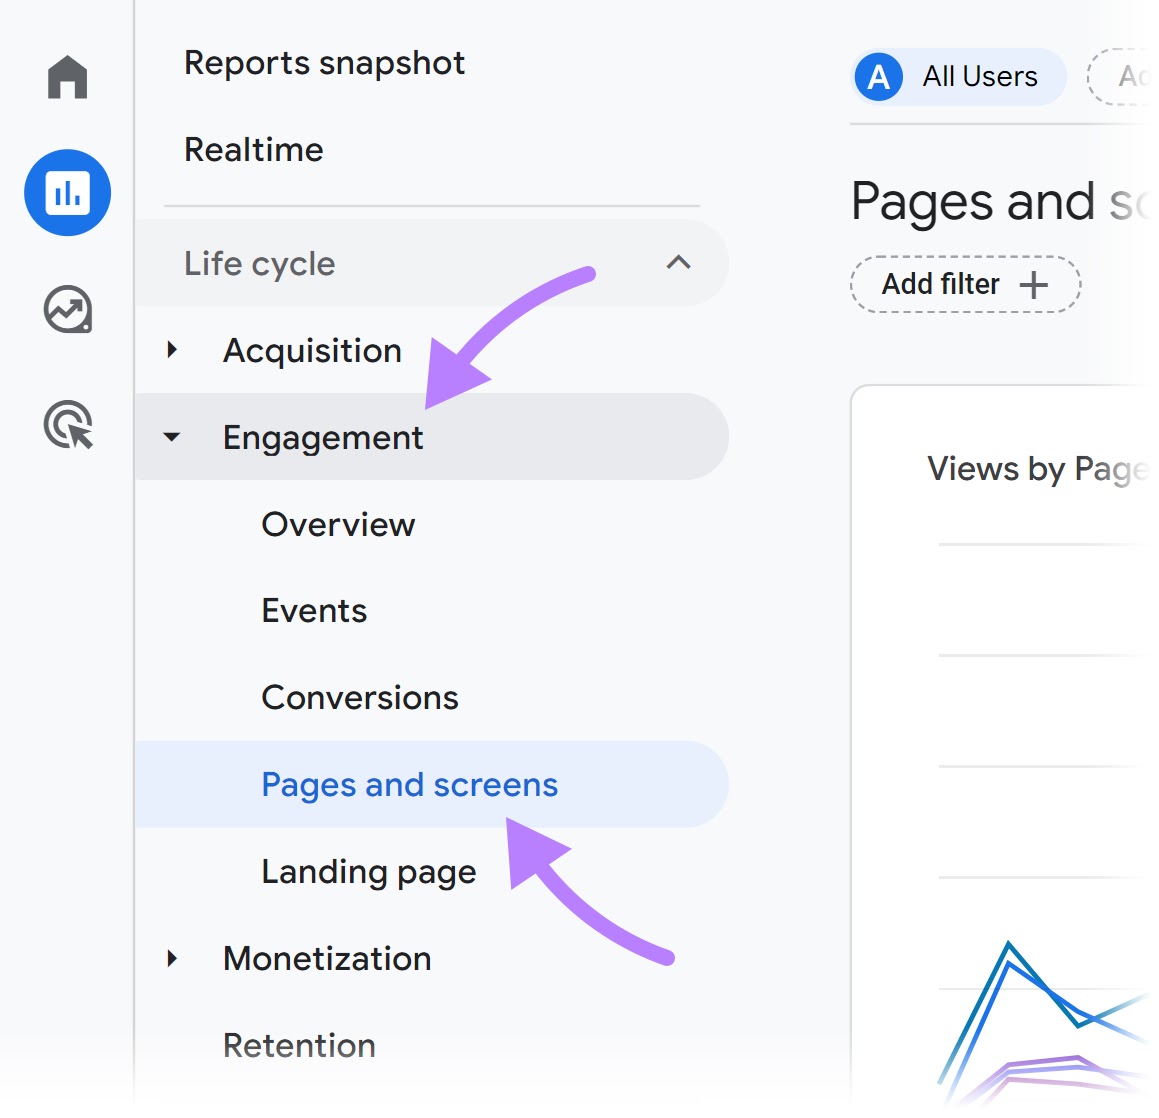
Then, click “Engagement” > “Pages and screens.”
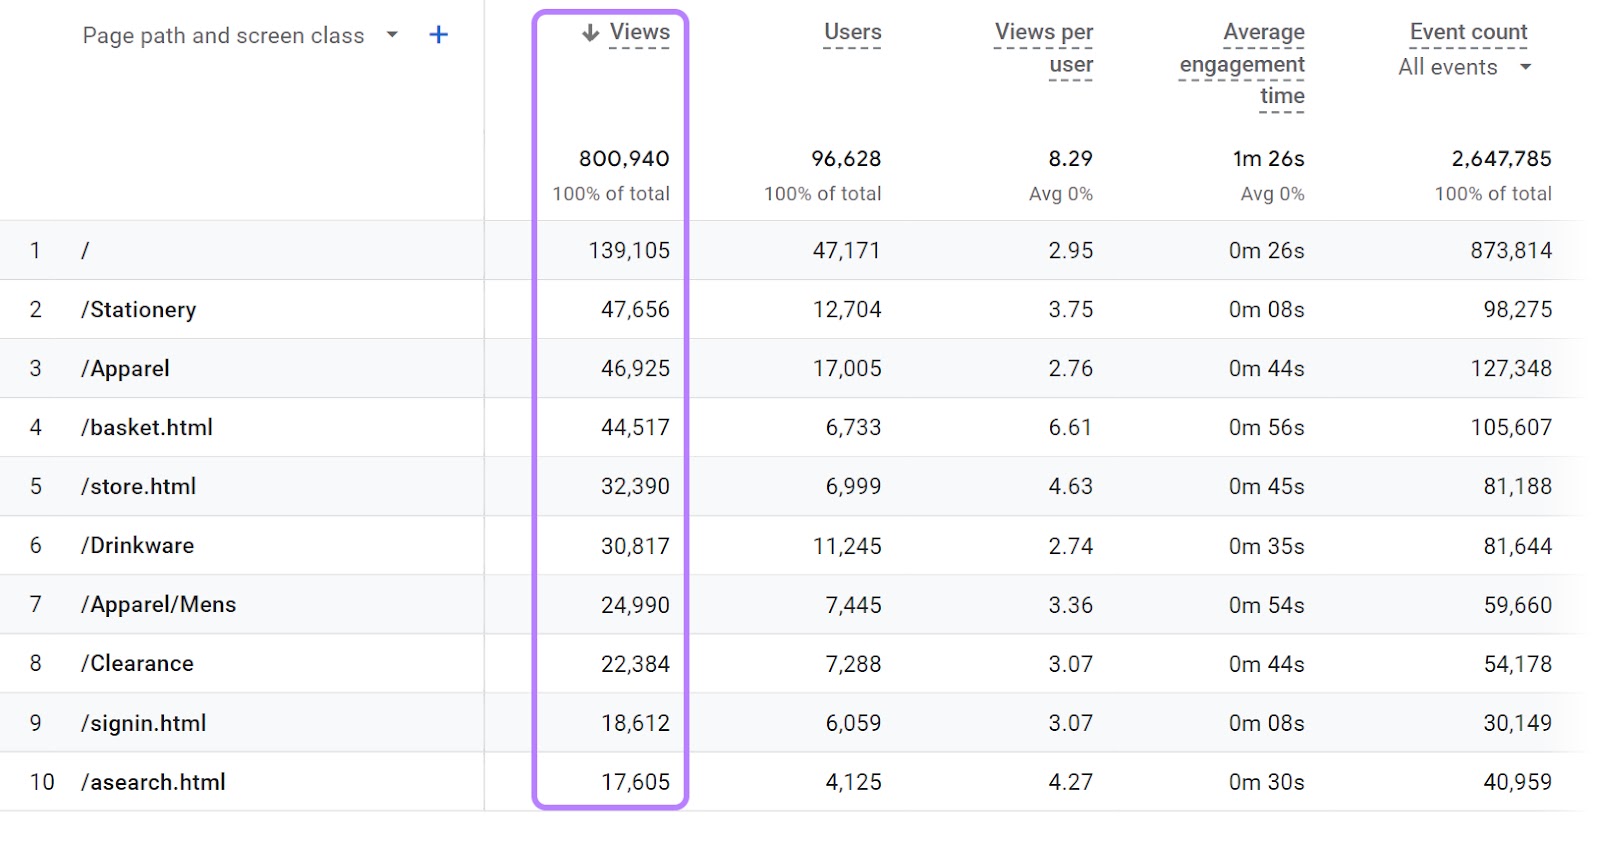
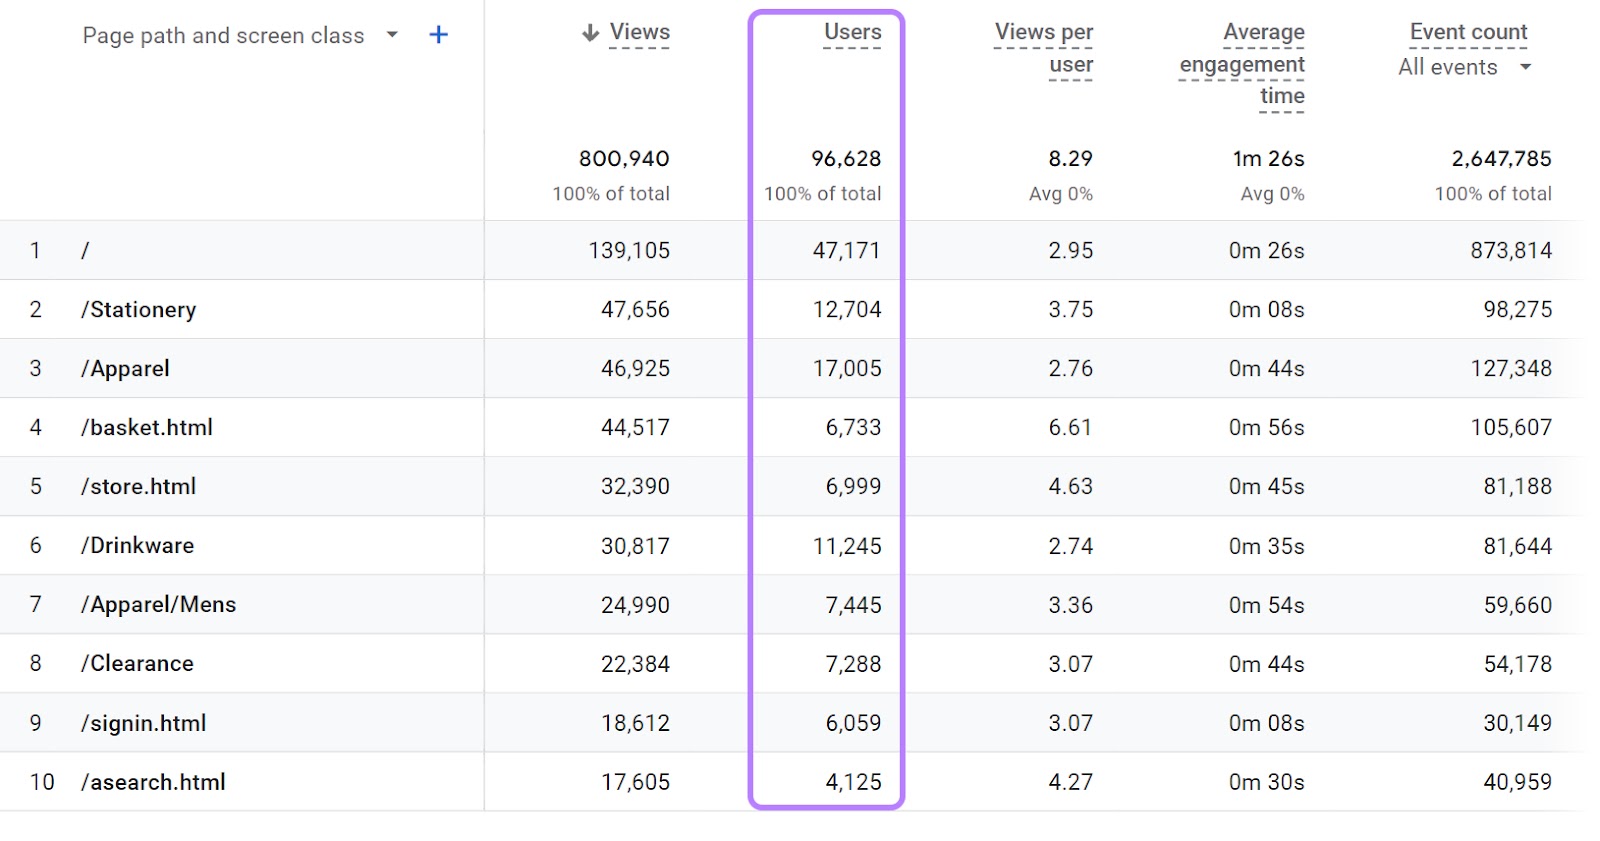
Scroll down to see the table. The first column will show you how many views each page gets, sorted from highest to lowest.
To customize the time period, click on the date range in the top-right corner.
Choose a predefined range from the left-hand menu. Or select a custom time frame in the calendar on the right.
Then, click “Apply.”
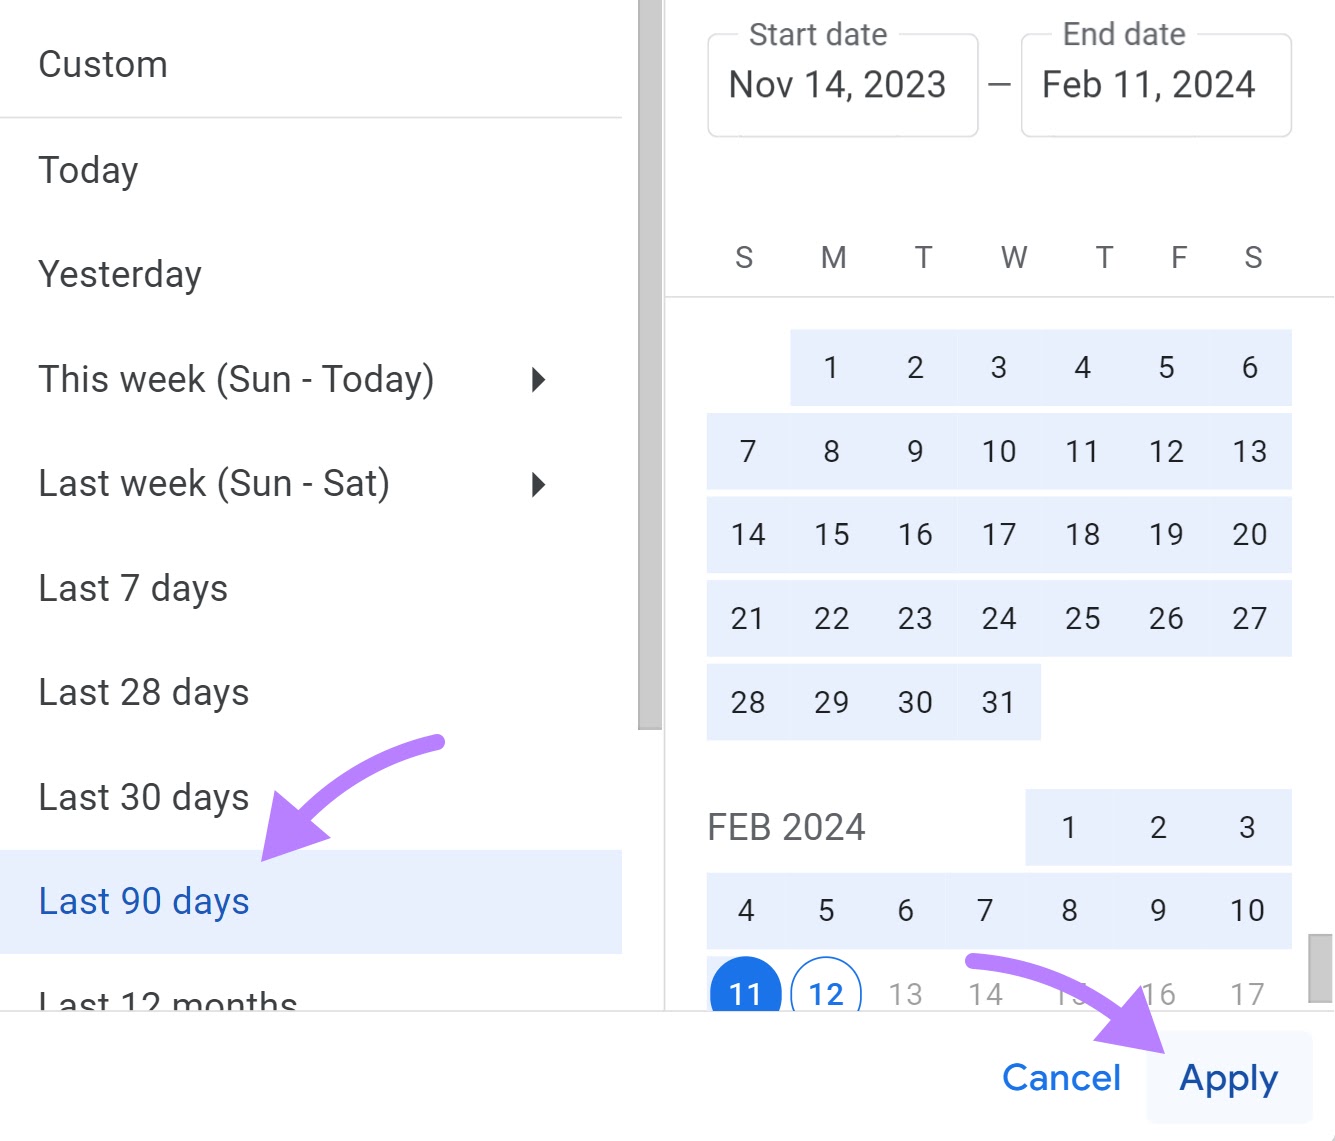
You can now analyze this metric for the selected date range.
Users
The number of users refers to the number of unique visitors to your pages. It can help you understand the size of your audience and how frequently they visit your site.
For example, let’s say a certain page gets 100 views from a single user. Your audience isn’t 100 people—it’s one person.
You‘ll see users in the second column of the “Pages and screens” table we explored before. Right next to the number of views.
New Users
New users are visitors who are seeing your website for the first time.
Having a steady flow of new users indicates that your traffic acquisition efforts are working well. And it also means that the number of potential leads is increasing.
To see this metric, go to your GA4 account.
In the menu on the left, click “Acquisition” > “Overview.”
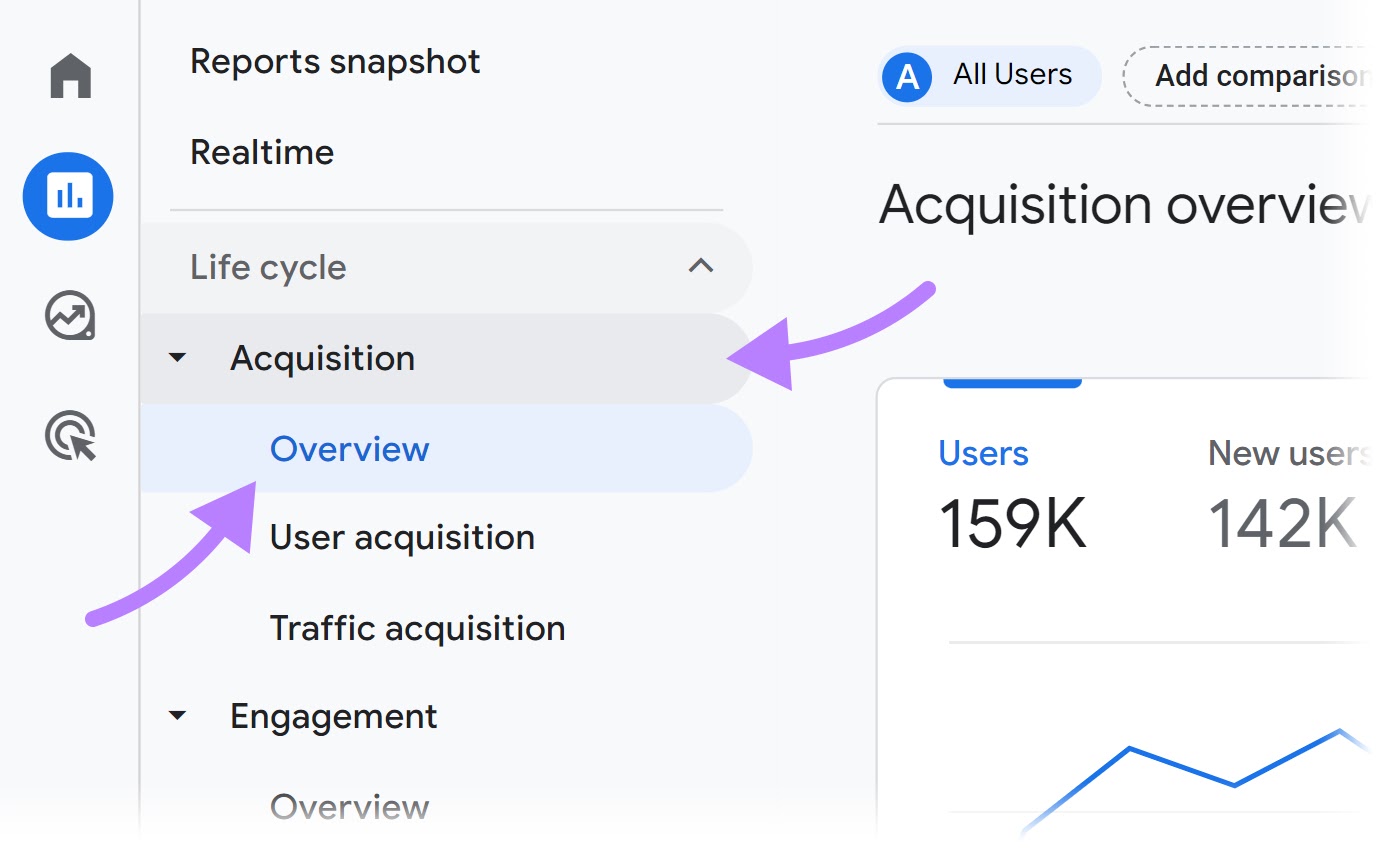
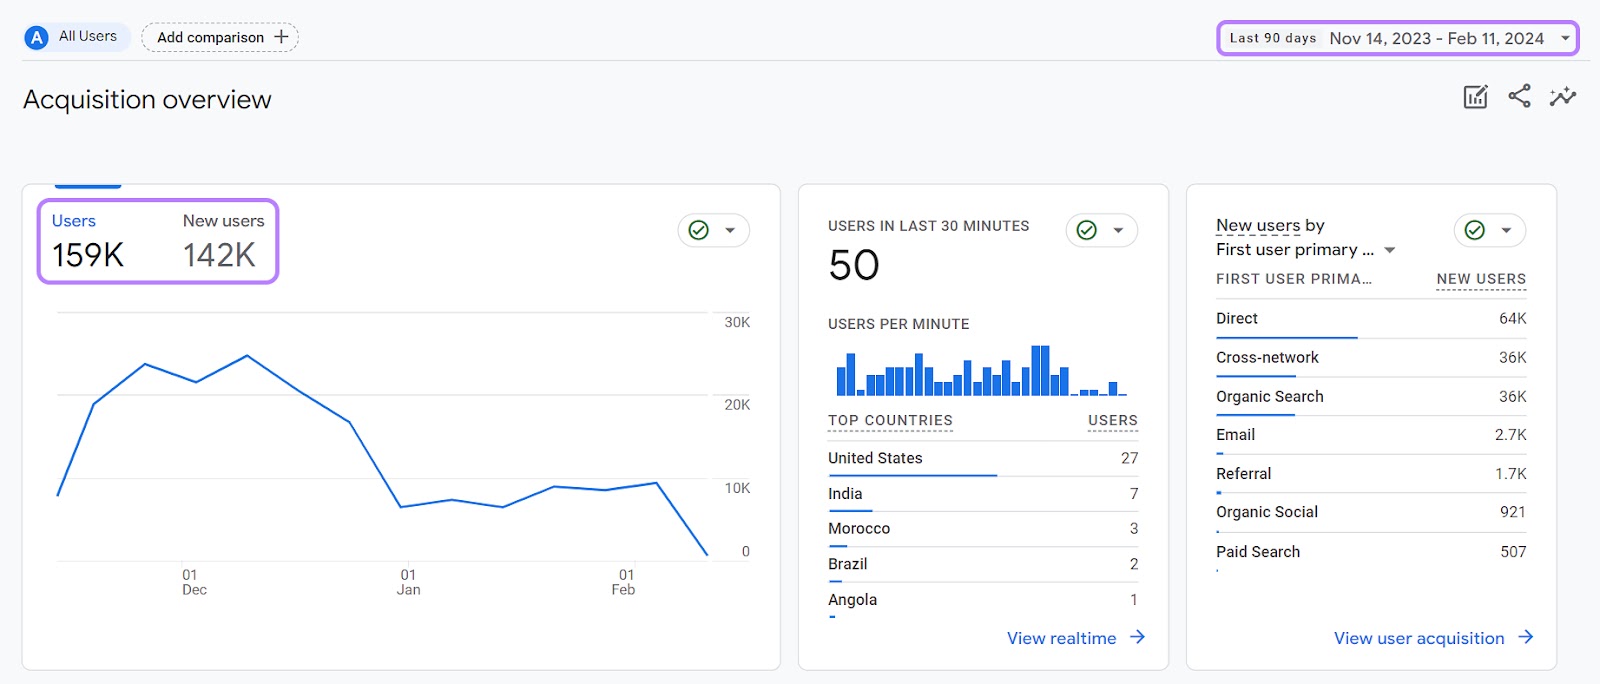
You’ll get an overview of both users and new users. And in the top right corner, you can choose a specific time frame to analyze.
Bounce Rate
Bounce rate shows the percentage of all sessions on your website that were unengaged. Here’s how Google defines engaged sessions:
An engaged session is a session that lasts longer than 10 seconds, has a conversion event, or has at least 2 pageviews or screenviews.
When a page has a high bounce rate, there could be an issue you may need to assess and fix.
For example, your content may not be aligned with what the user’s looking for. Or, your website might have a technical problem that affects how quickly the page loads.
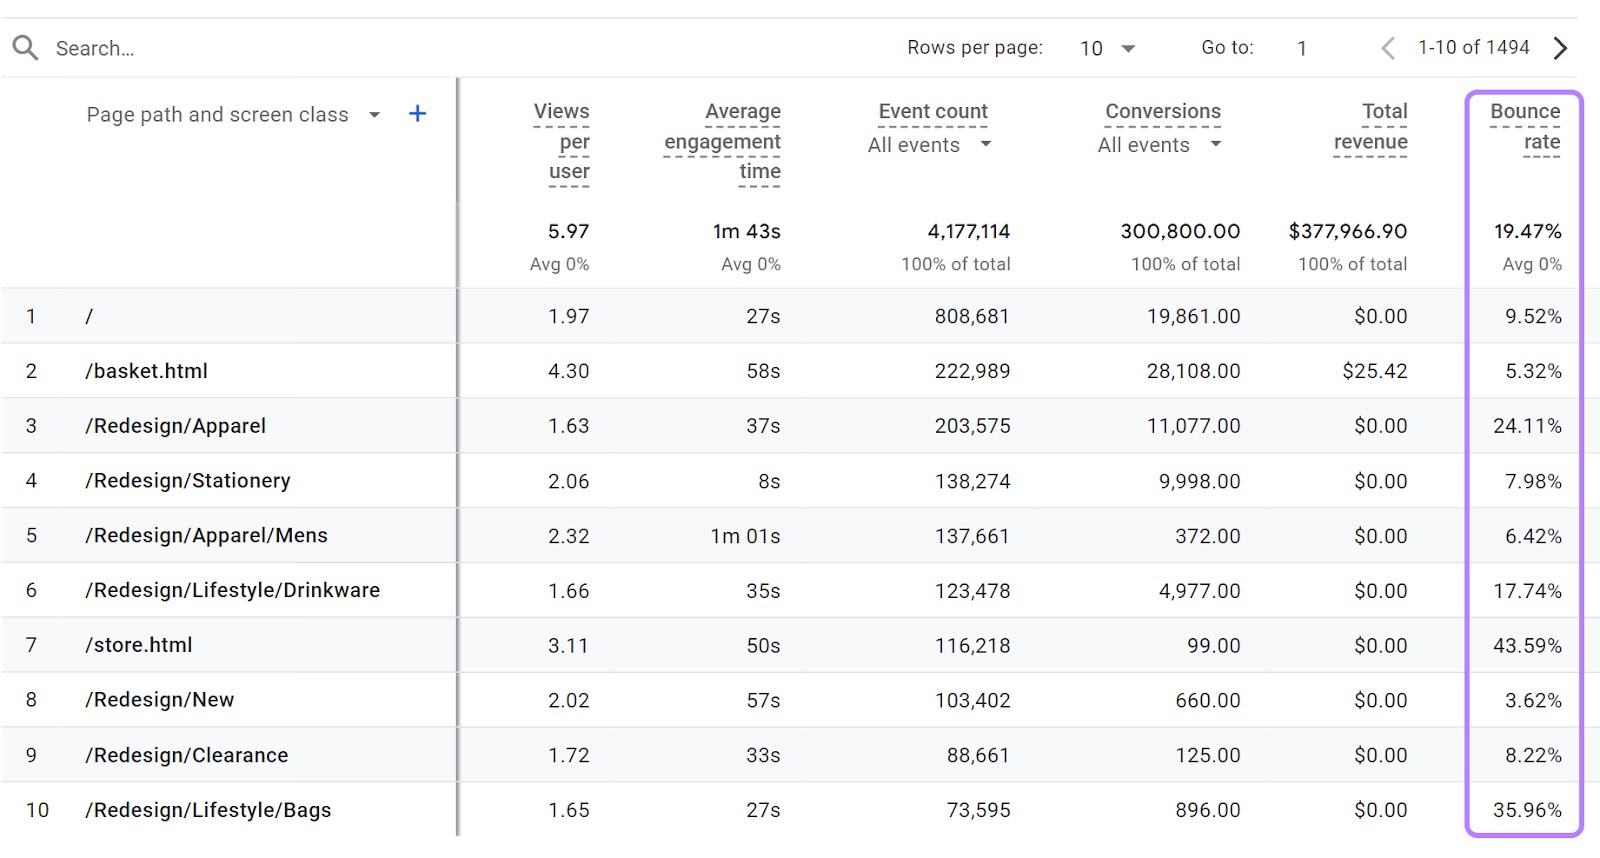
In GA4, the bounce rate isn’t visible by default. Add it on your own by customizing specific reports.
To do that, you’ll need to have Editor or Administrator access to a GA4 account.
In the menu on the left, click “Reports,” then choose a report you want to customize. For example, “Pages and screens.”

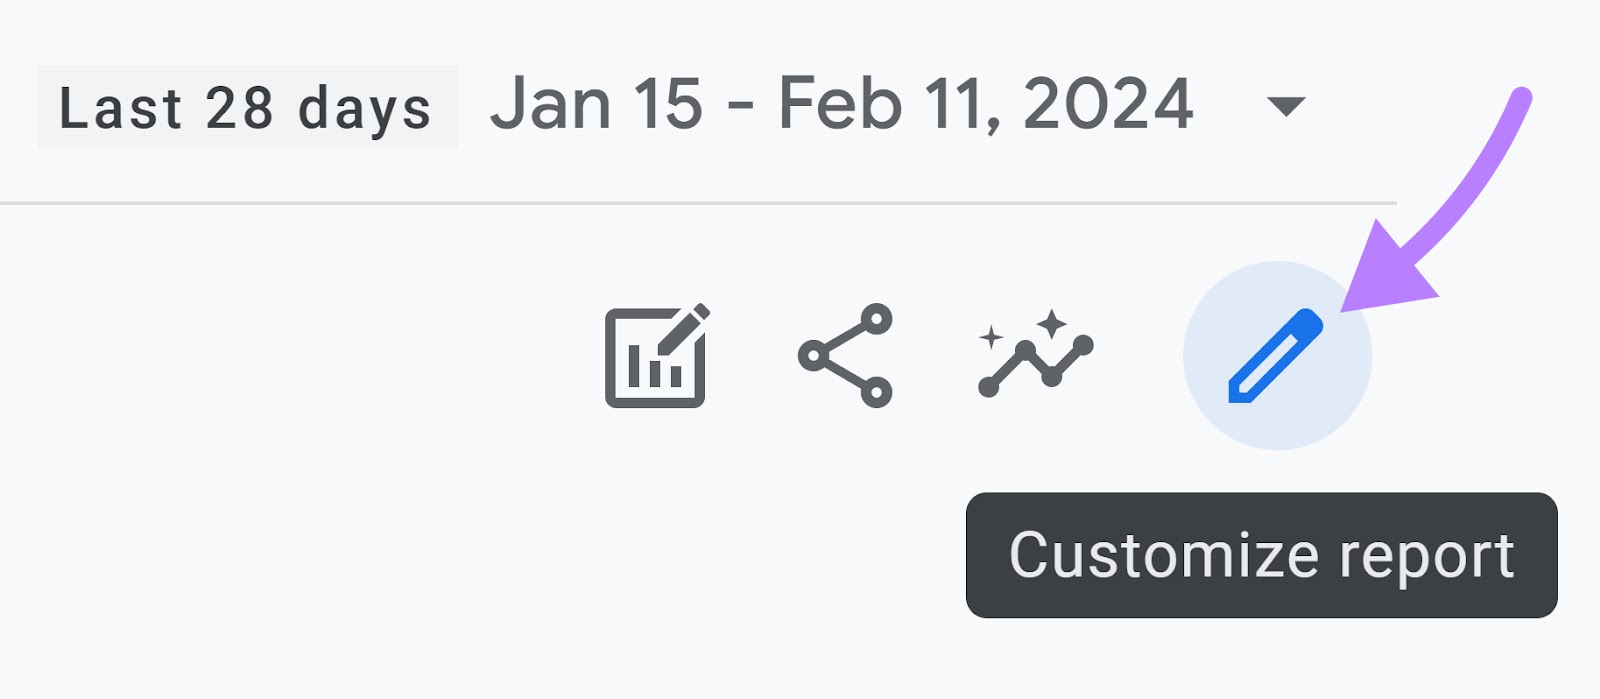
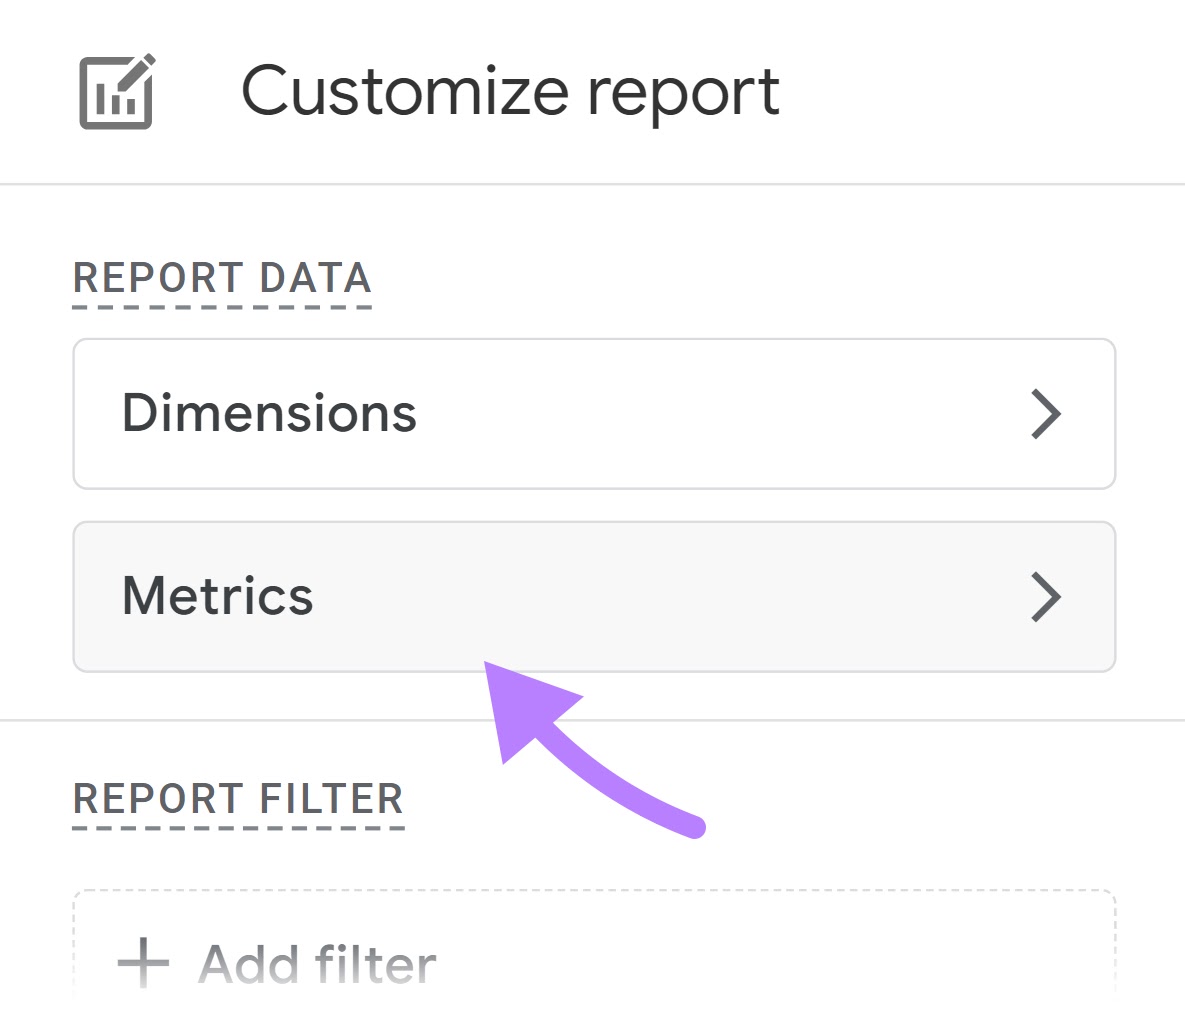
In the top right corner, click on the pen symbol to customize the report.
Click “Metrics.”
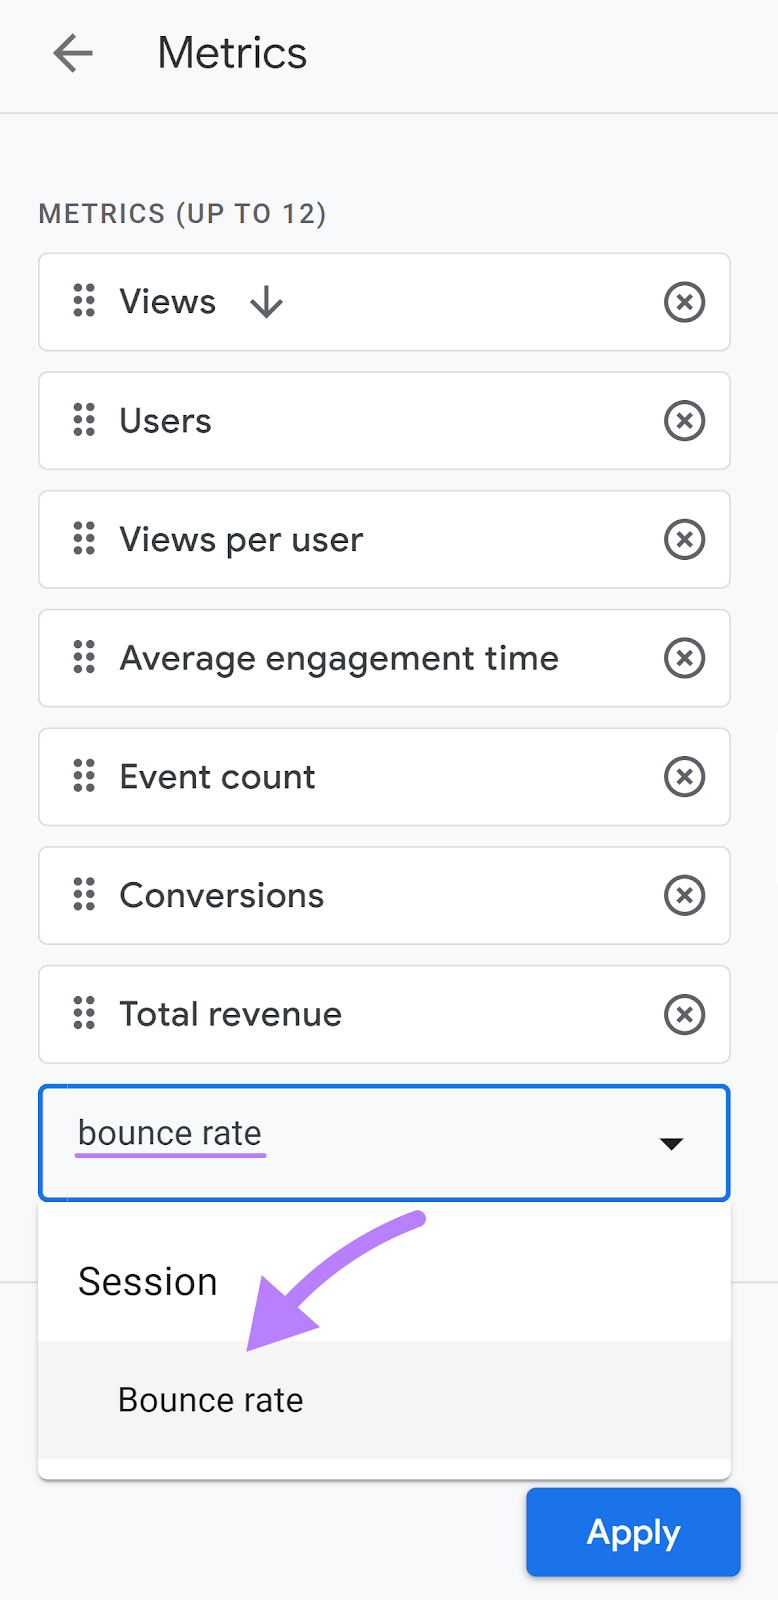
Click the “Add metric” field and enter “bounce rate.” Then, click on the metric once it shows up in the menu.
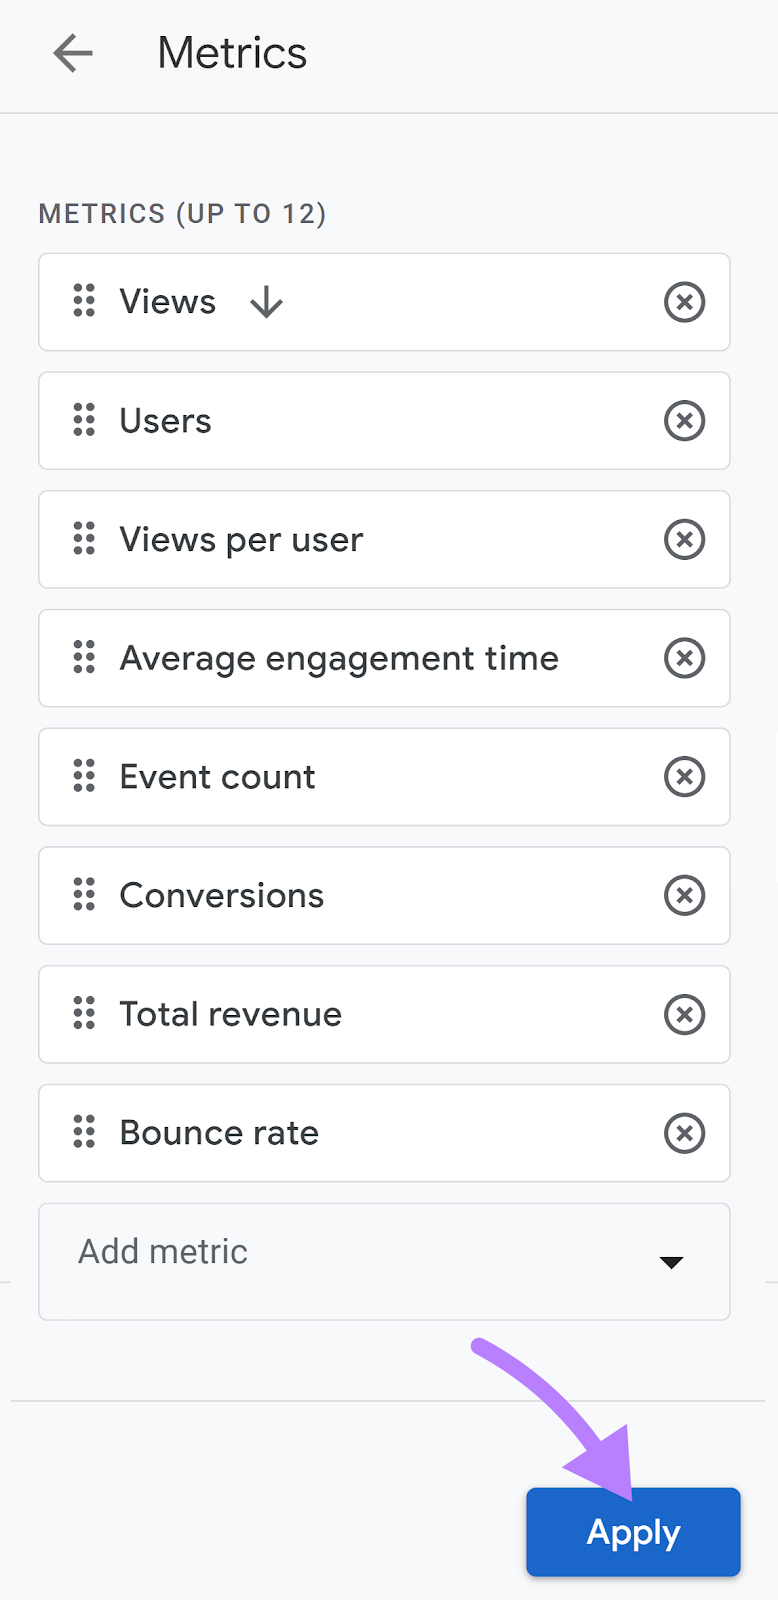
Click “Apply” to save your customization.
You’ll now see the bounce rate metric in your report.
Traffic Sources
Traffic sources show you how many users come from each specific type of traffic source (e.g., organic search results, social media, email, etc.).
This content marketing metric can help you discover the most and least effective marketing channels for specific content.
For example, let’s say you’re working on increasing organic traffic to your website.
If your content gets little traffic from organic search and significantly more traffic from other sources, you may need to revisit your SEO efforts.
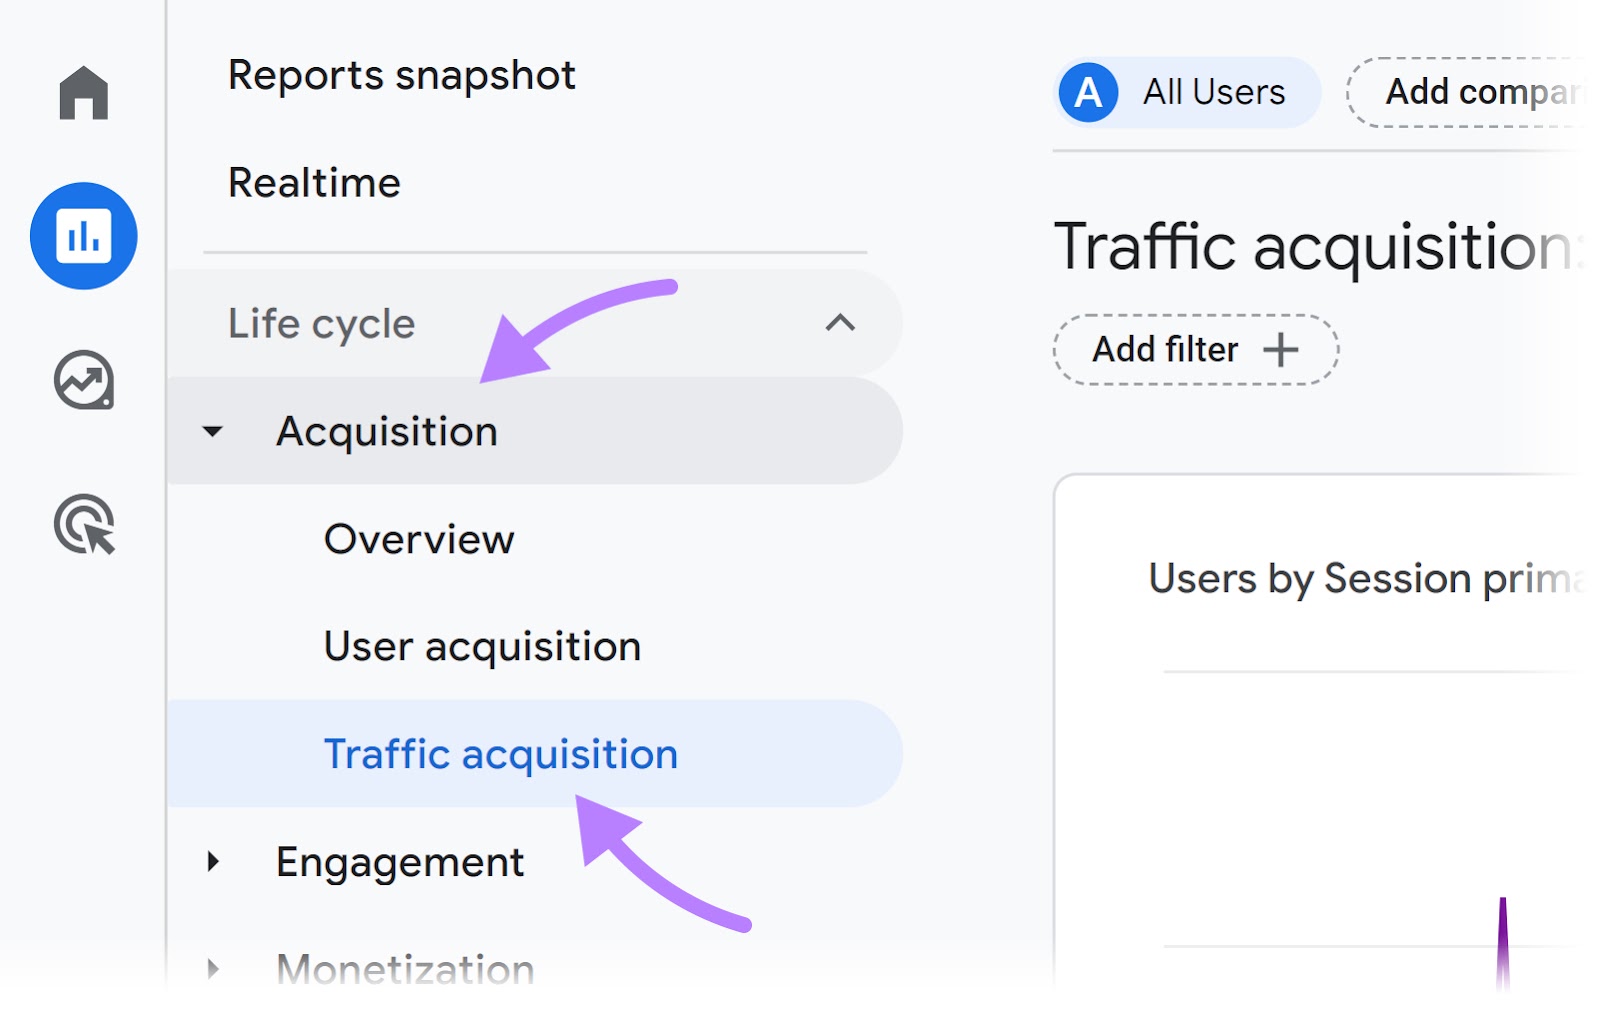
To see traffic sources, go to GA4. In the menu on the left, click “Acquisition” > “Traffic acquisition.”
You’ll see metrics for different groups of traffic sources like organic social and referral traffic.
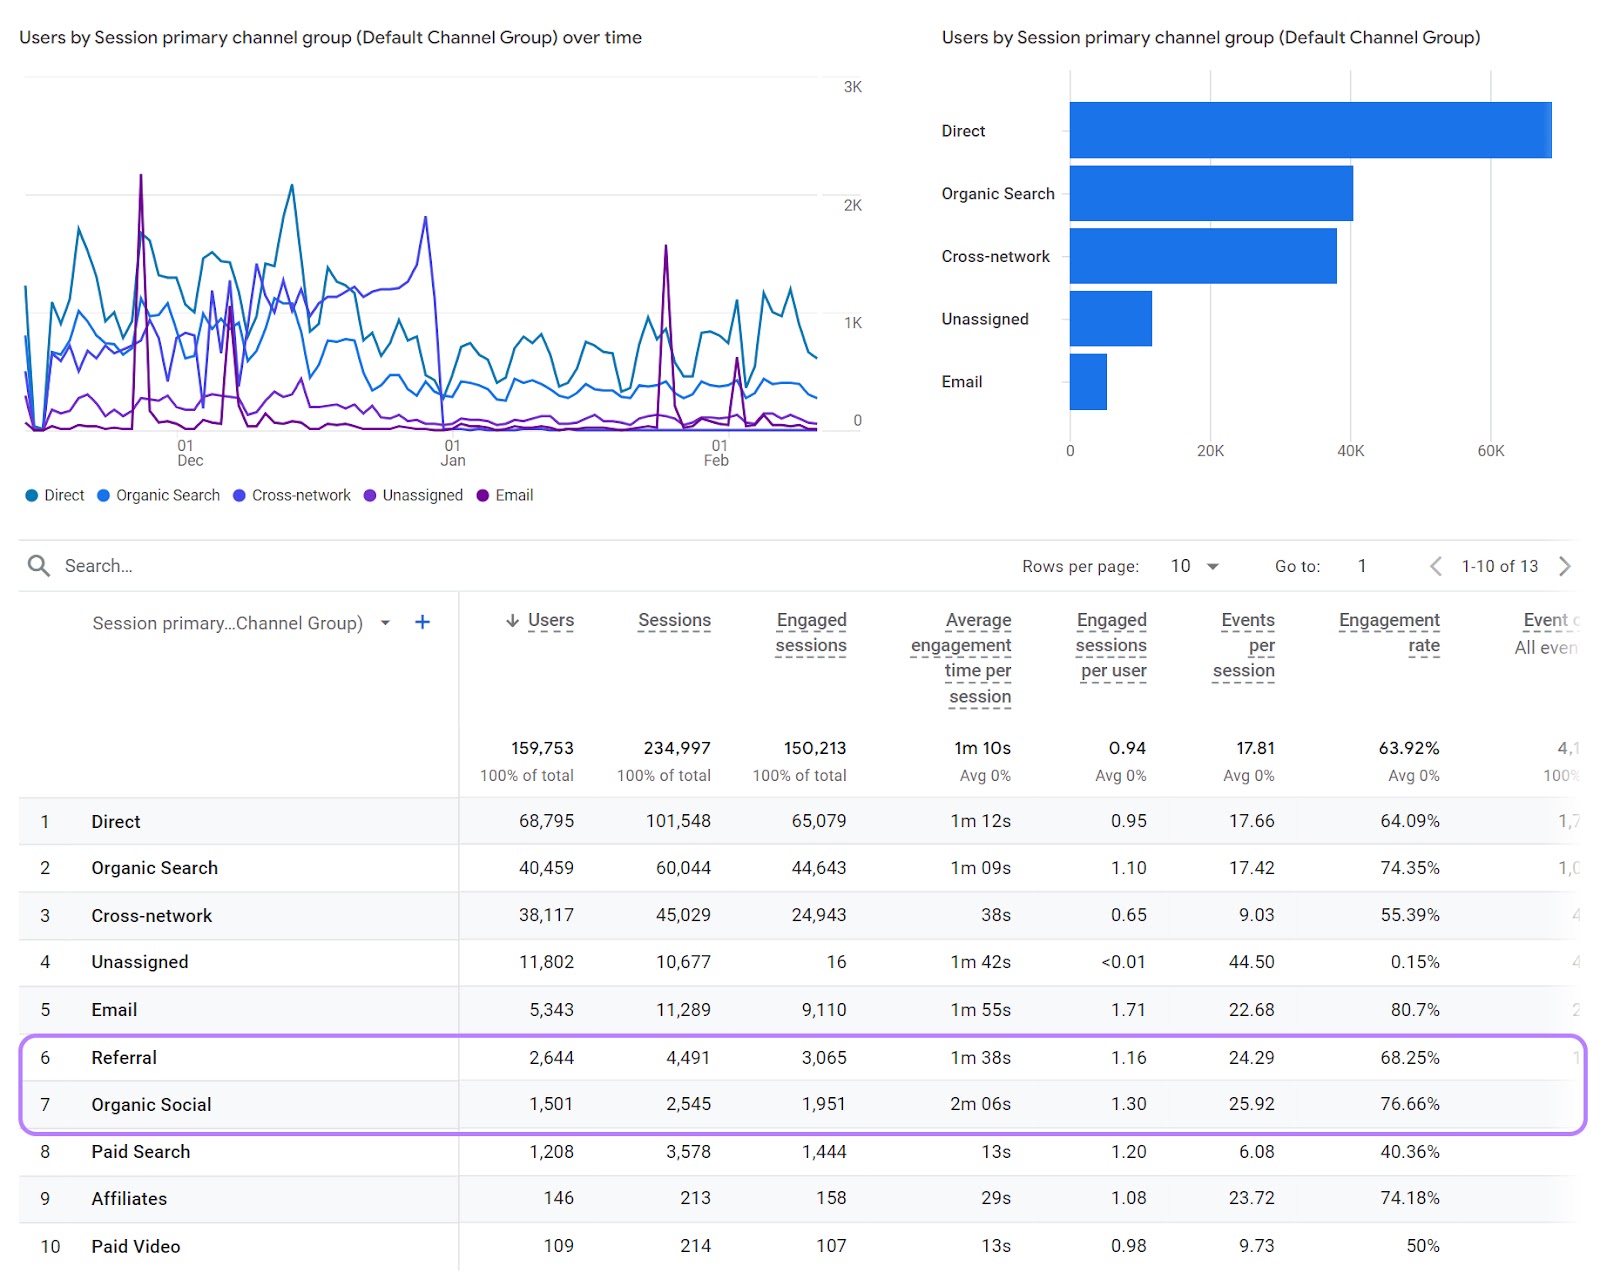
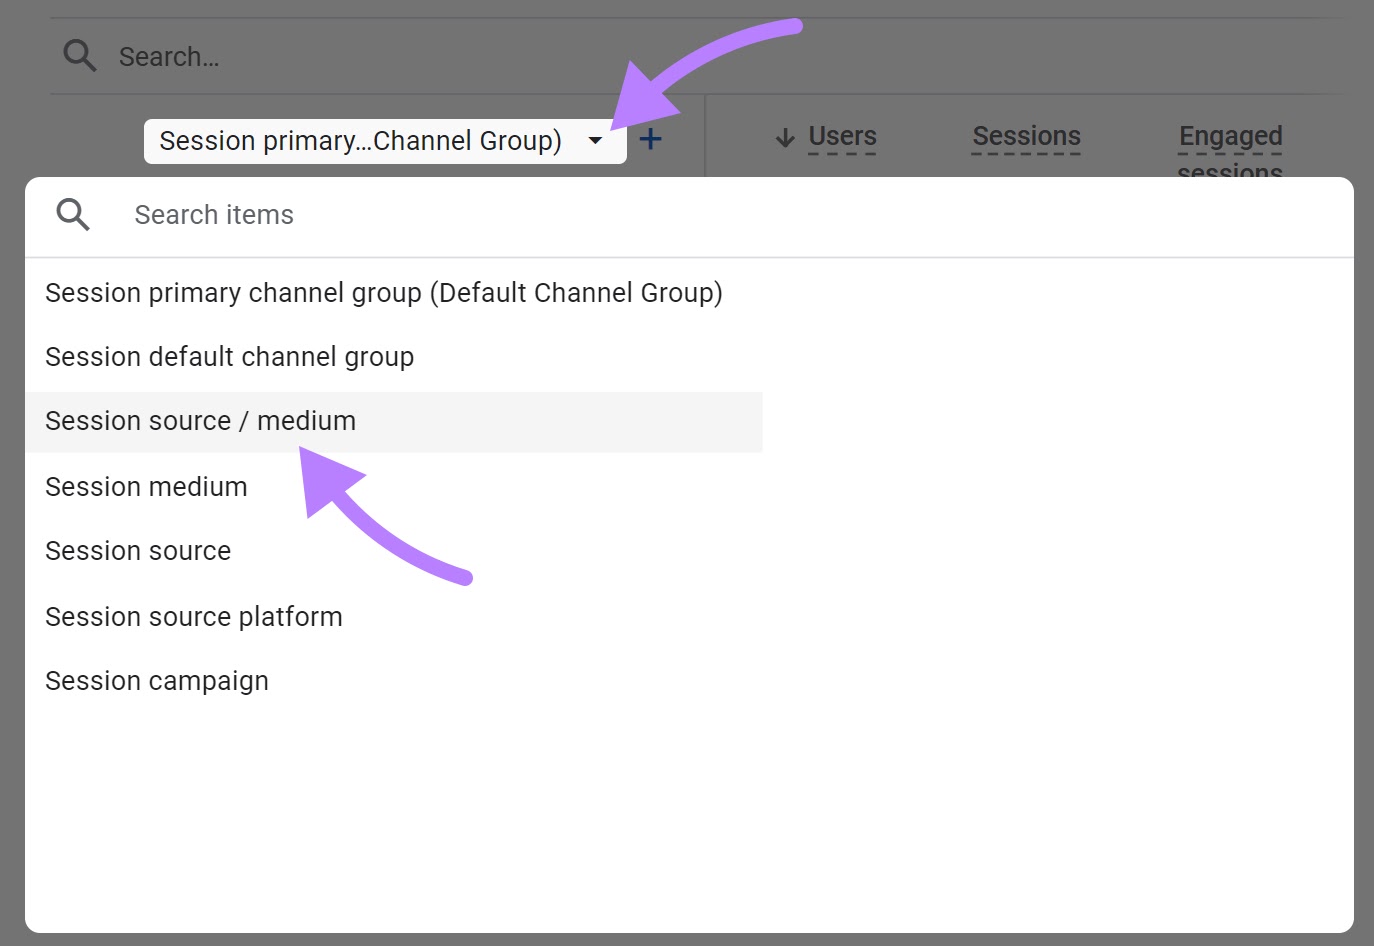
Go a step further and identify specific platforms and websites that bring traffic to your website.
Click “Session primary channel group (Default Channel Group).” Once the drop-down menu opens up, select “Session source / medium.”
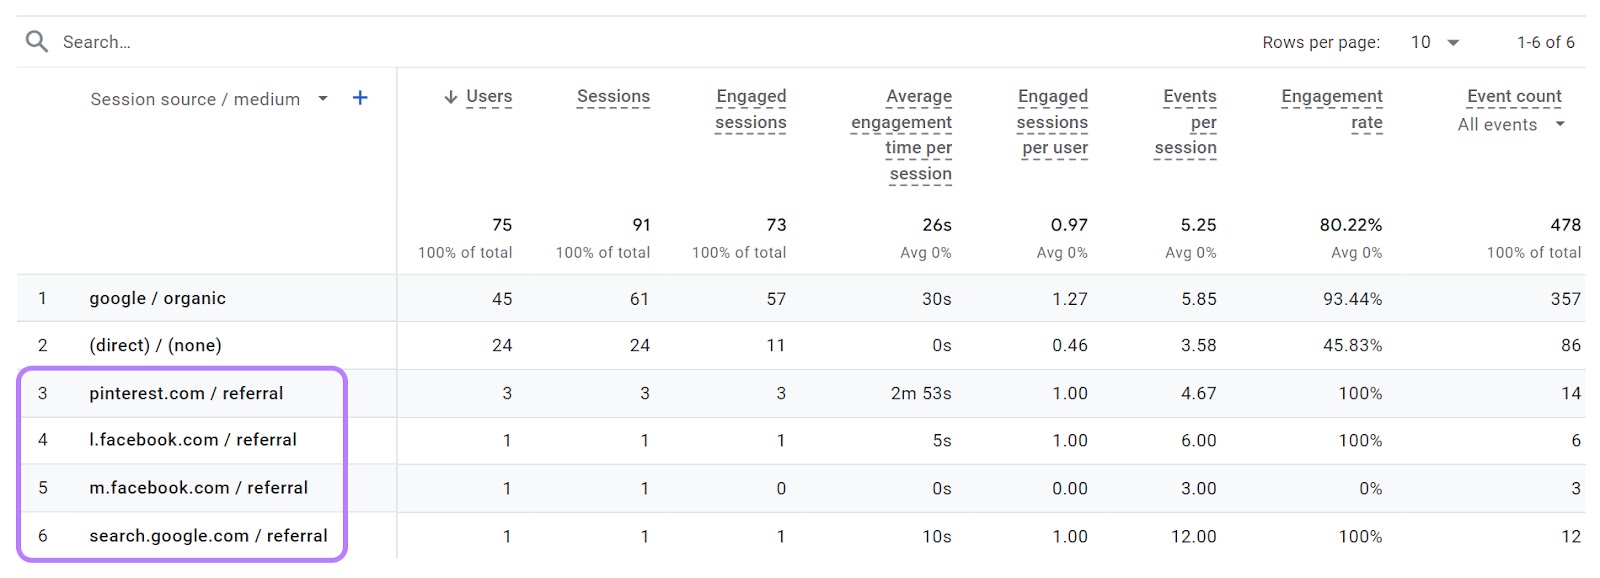
You’ll see a list of sources (platforms and websites) and their medium (which channel group they belong to). Like this:
SEO & Visibility Metrics
SEO metrics show how well your website is ranking in search engine results and driving organic traffic.
Organic Traffic
Organic traffic refers to the number of sessions your website gets from organic search.
This metric will show you how successful your SEO strategy is and whether you’re optimizing your content properly.
To see organic traffic measured in sessions, log in to your Google Analytics account.
In the menu on the left, click “Reports” > “Acquisition” > “Traffic Acquisition.”

You’ll see a broad overview of traffic sources for your website.
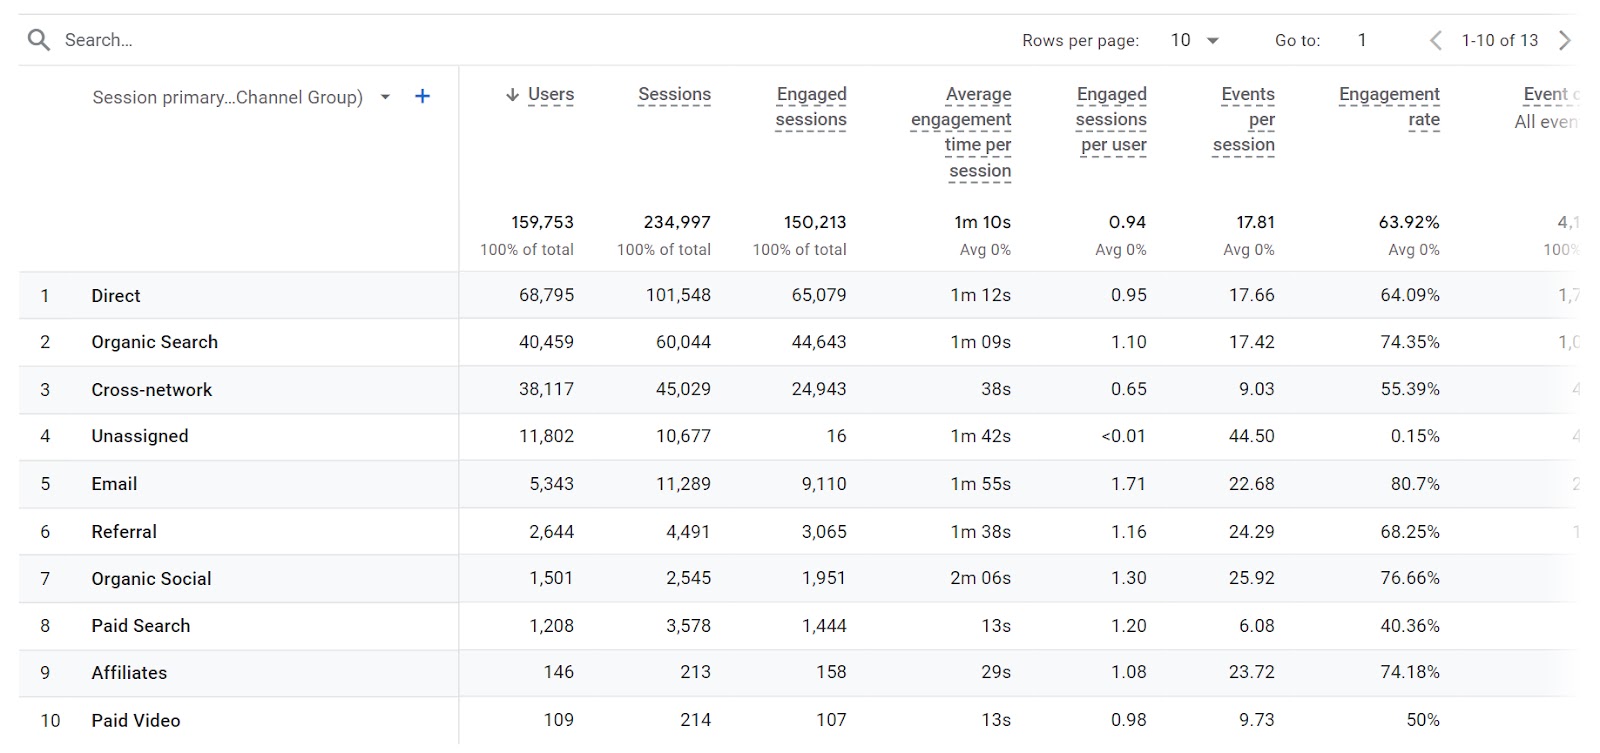
Let’s see which search engines visitors use to find your website.
First, click on the blue “+” to the right of “Session default channel group.”
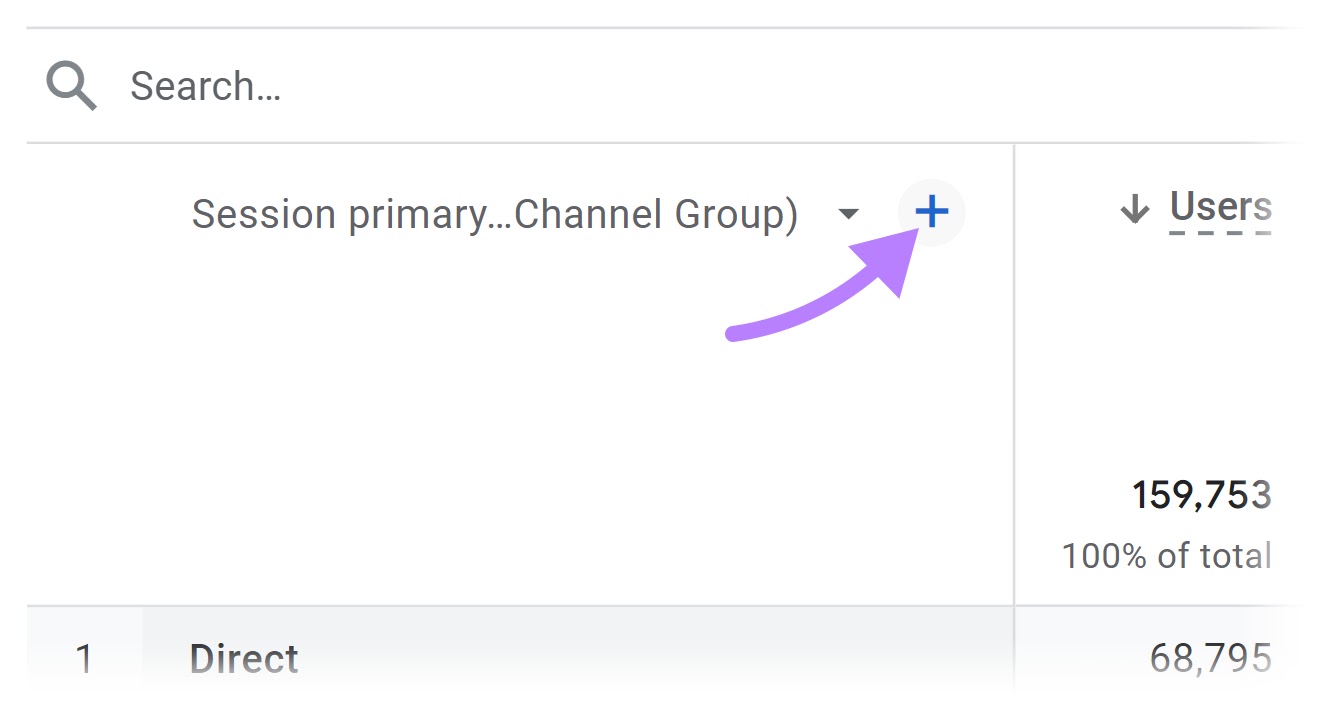
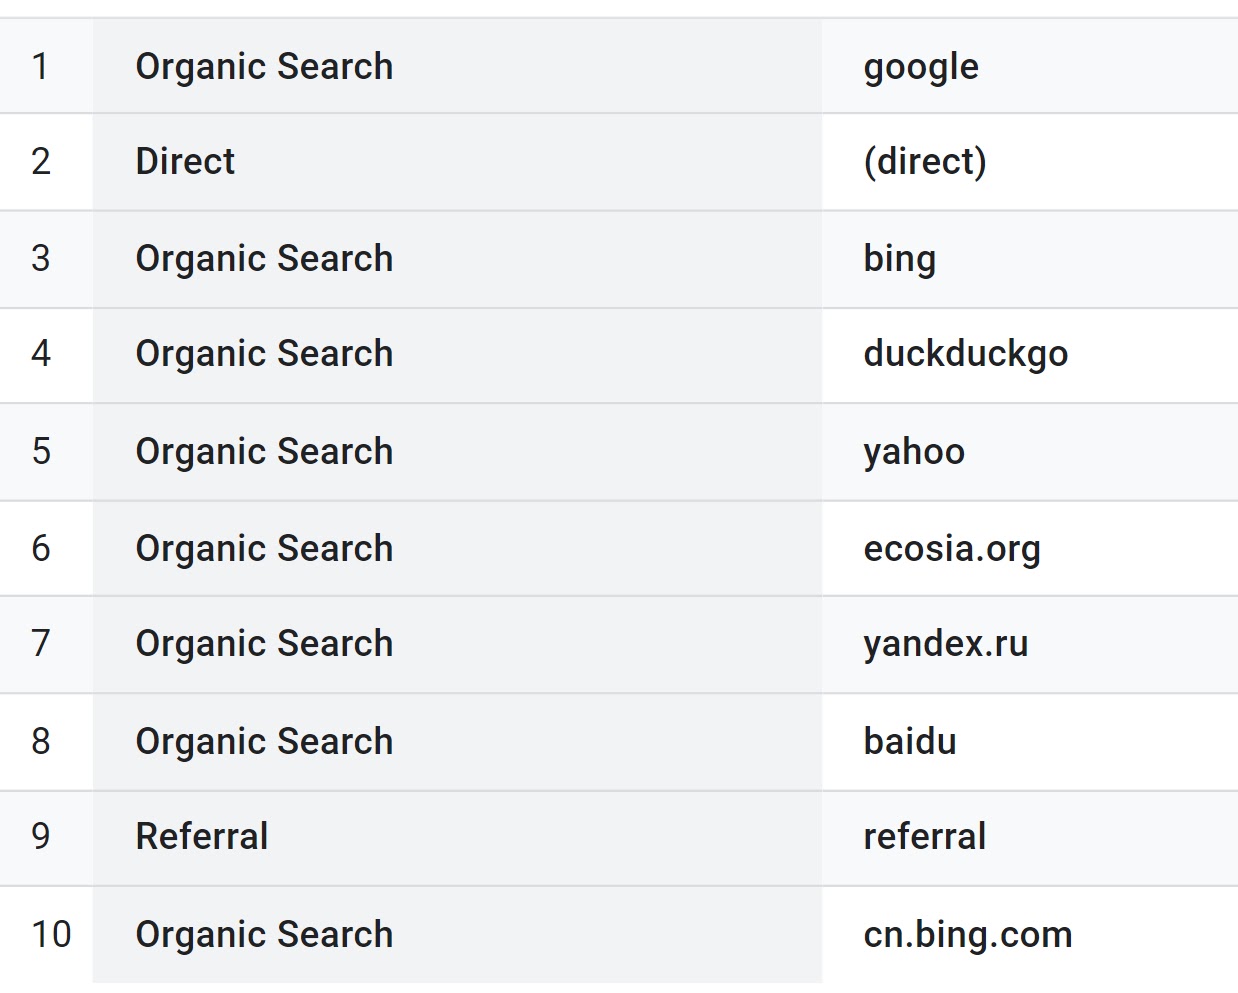
Then, search for “Session source” and choose it from the drop-down menu.

You’ll see sources of traffic for all types of channels. Let’s narrow it down.
Type “organic search” in the search bar and press “Enter” or “return” on your keyboard.
Now, you’ll see how many organic sessions your website gets from each search engine.
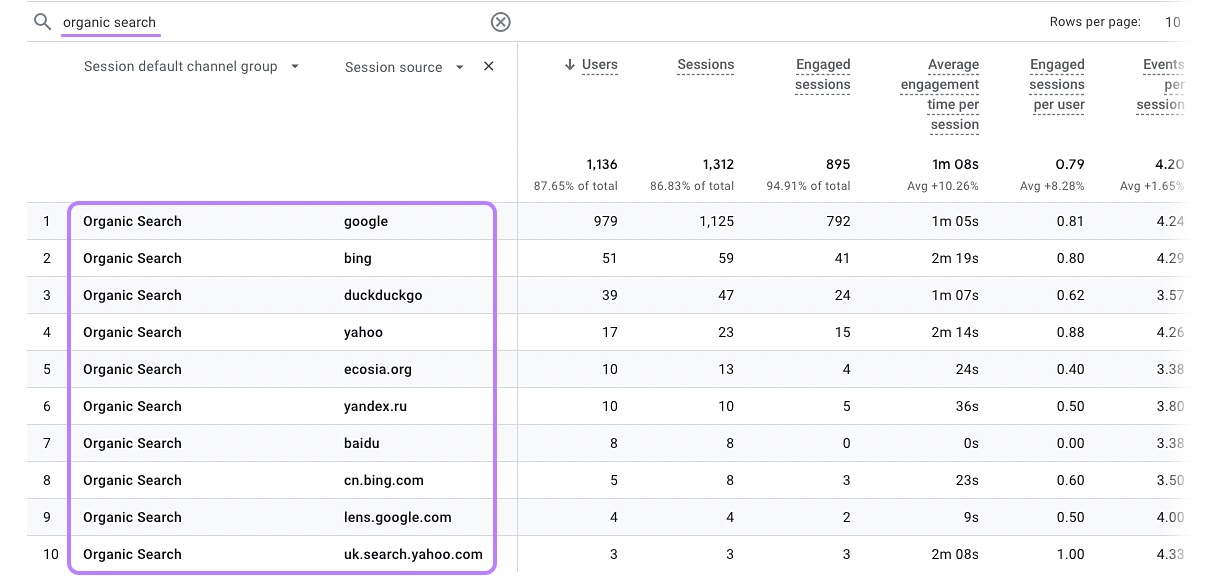
Check out our organic traffic in GA4 guide to learn more about analyzing it with different dimensions and metrics.
Dwell Time
Dwell time refers to the amount of time users’ coming from search spend on a page before going back to the search engine results page (SERP).
Analyzing dwell time on your pages can help you understand if your content is addressing search intent—the reason behind searchers’ queries.
There’s no official metric or formula to calculate dwell time, but the new GA4 metric “Average engagement time per session” comes pretty close.
Let’s explore:
Log in to your Google Analytics account. In the menu on the left, click “Reports” > “Engagement” > “Landing page.”
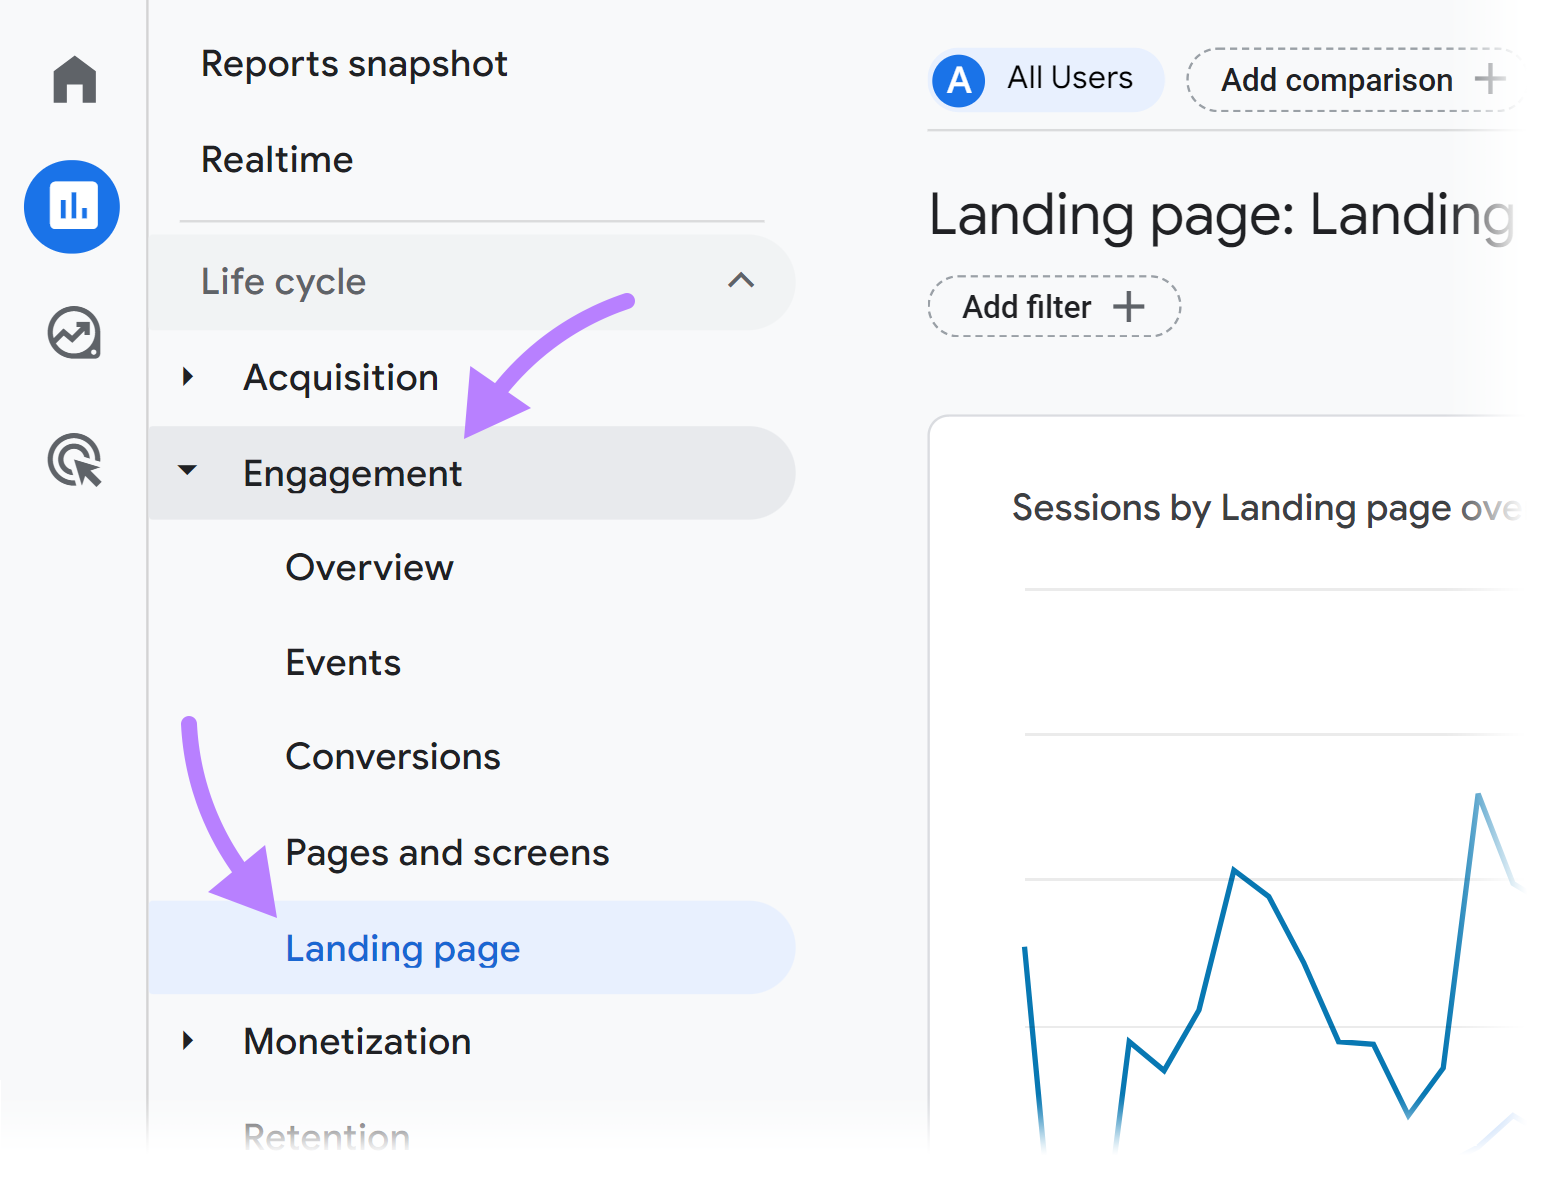
You’ll see a list of pages that users “land on” first when visiting your website.
The metric “Average engagement time per session” shows how long a user was engaged on your website before leaving.
Note that we don’t know whether they went back to search results, closed the tab, or went to another site.
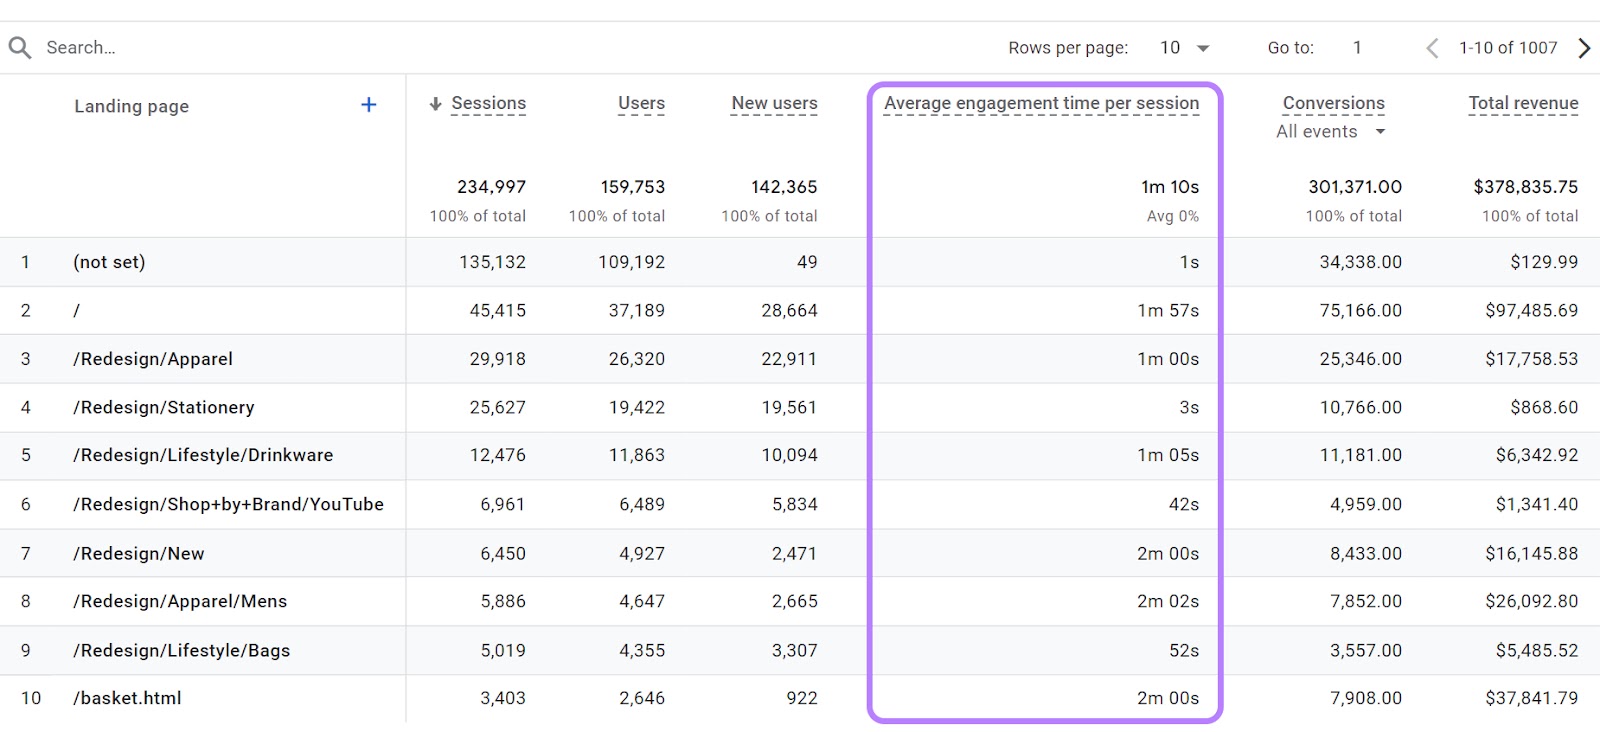
Right now, we’re seeing metrics for all traffic sources. Let’s narrow it down so it’s showing results just for people coming from search.
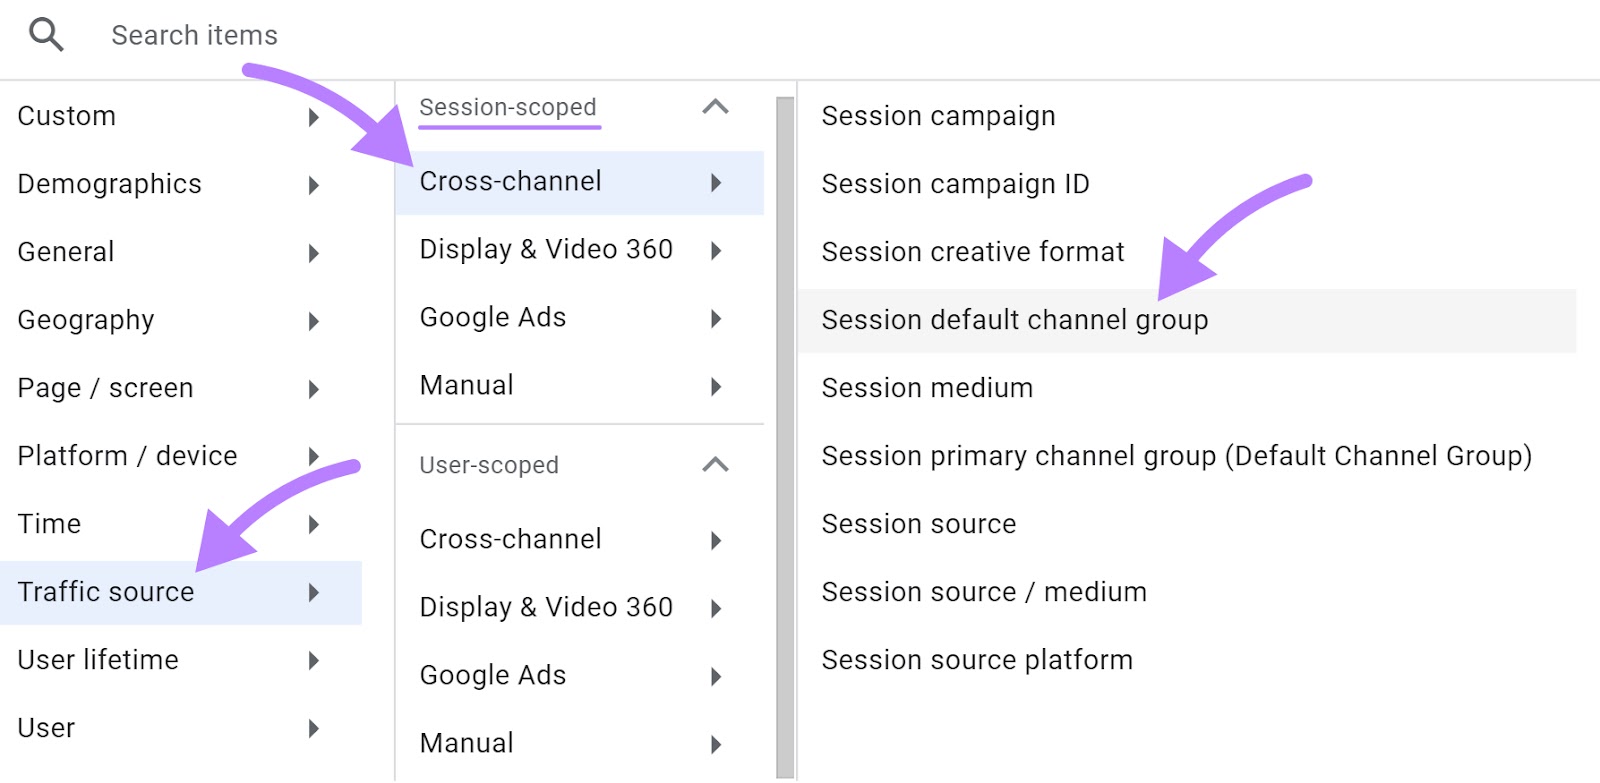
Click on the blue “+” sign next to “Landing page.”
Once the menu opens up, click “Traffic source” > “Cross-channel” (in the “Session-scoped” section) > “Session default channel group.”
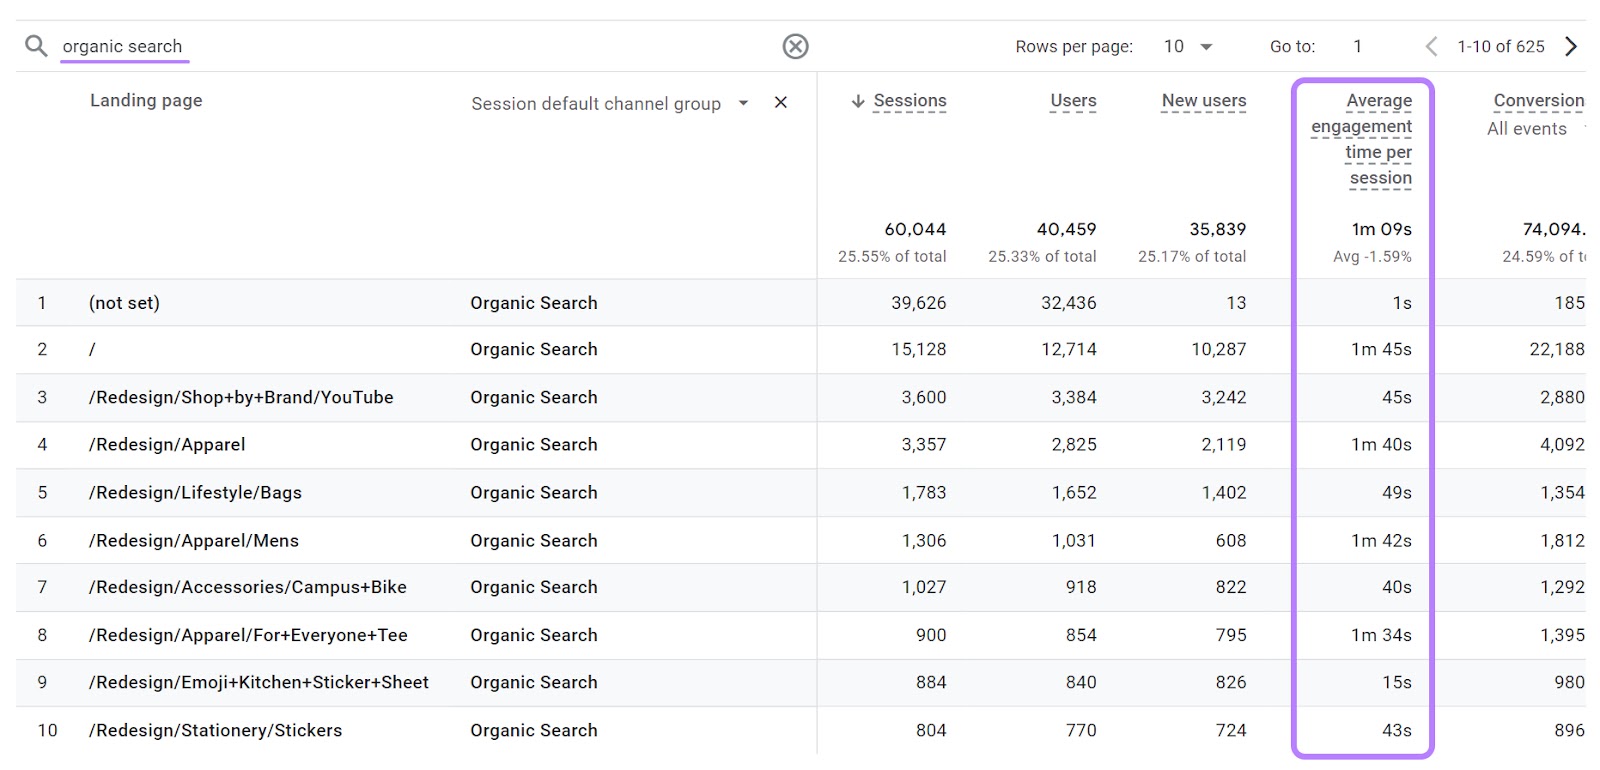
Now, type “organic search” in the search bar to see only the metrics for organic traffic.
Out of this list, the pages that have a low “Average engagement time per session” can be considered to have a low dwell time.
Keyword Rankings
Keyword rankings show the position of your pages in search results for their target search terms.
Following your keyword rankings lets you know whether your content is getting visibility among your target readers.
And if you notice some sudden drops in your rankings, you can react quickly. And examine what the issue is before it becomes a bigger problem.
Semrush’s Position Tracking makes it easy for you to track a large number of keywords for your website.
Here’s how to set it up:
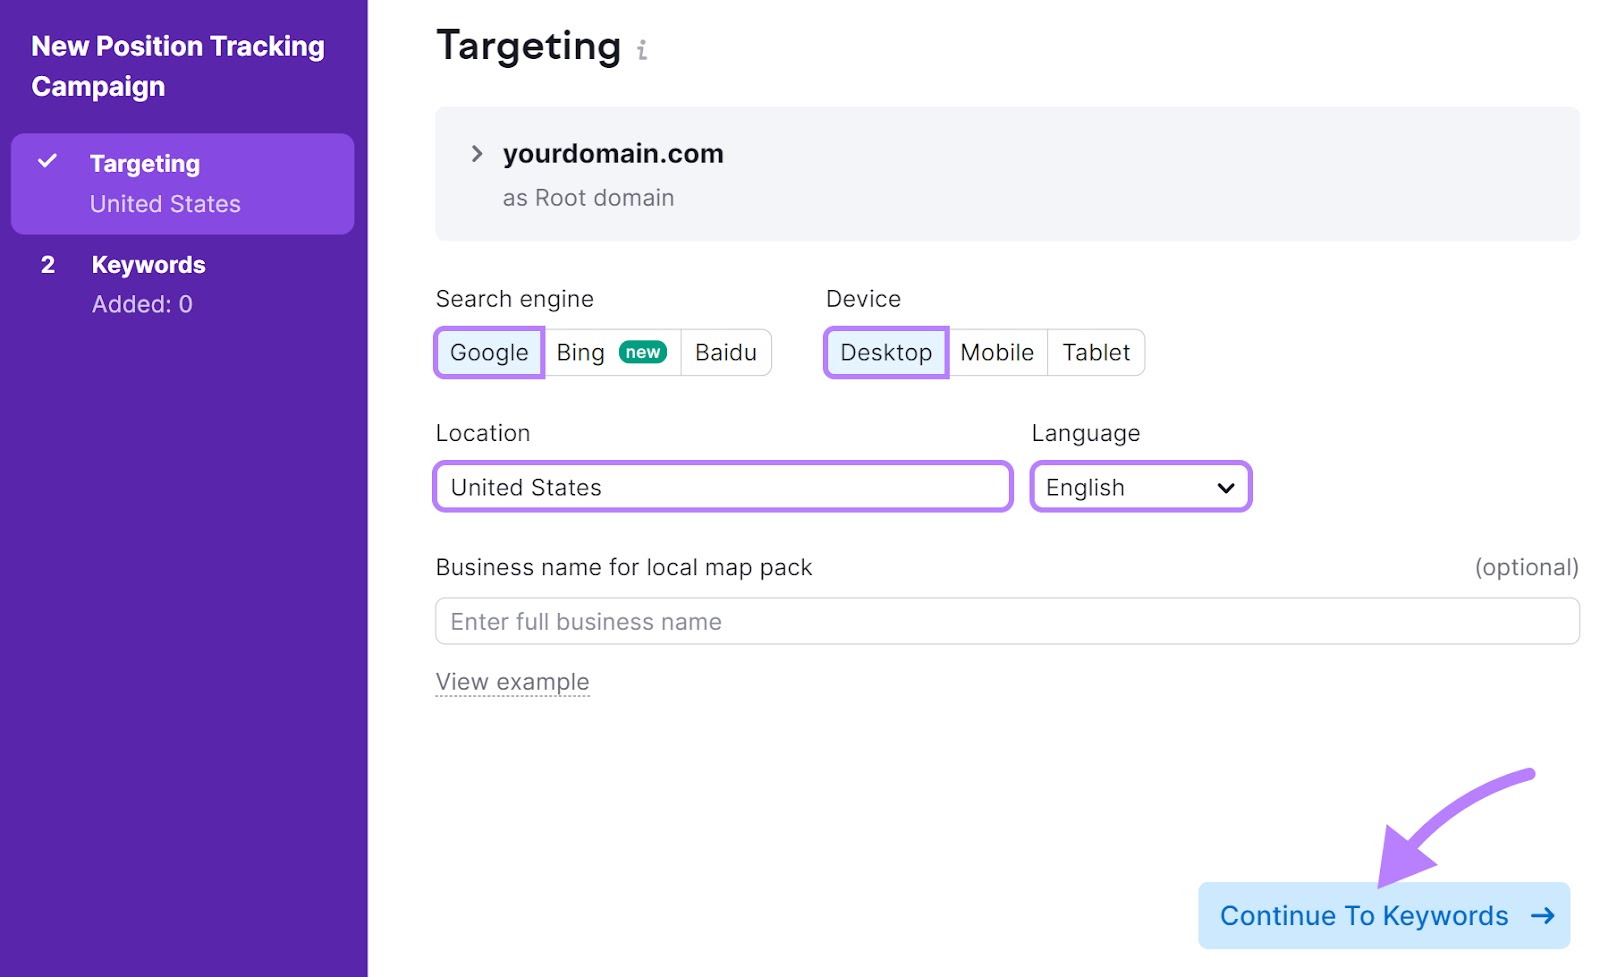
Go to the tool, enter your domain, and click “Set up tracking.”

Choose the parameters you want to track rankings for. Like search engine, device type, location, and language.
Click “Continue To Keywords.”
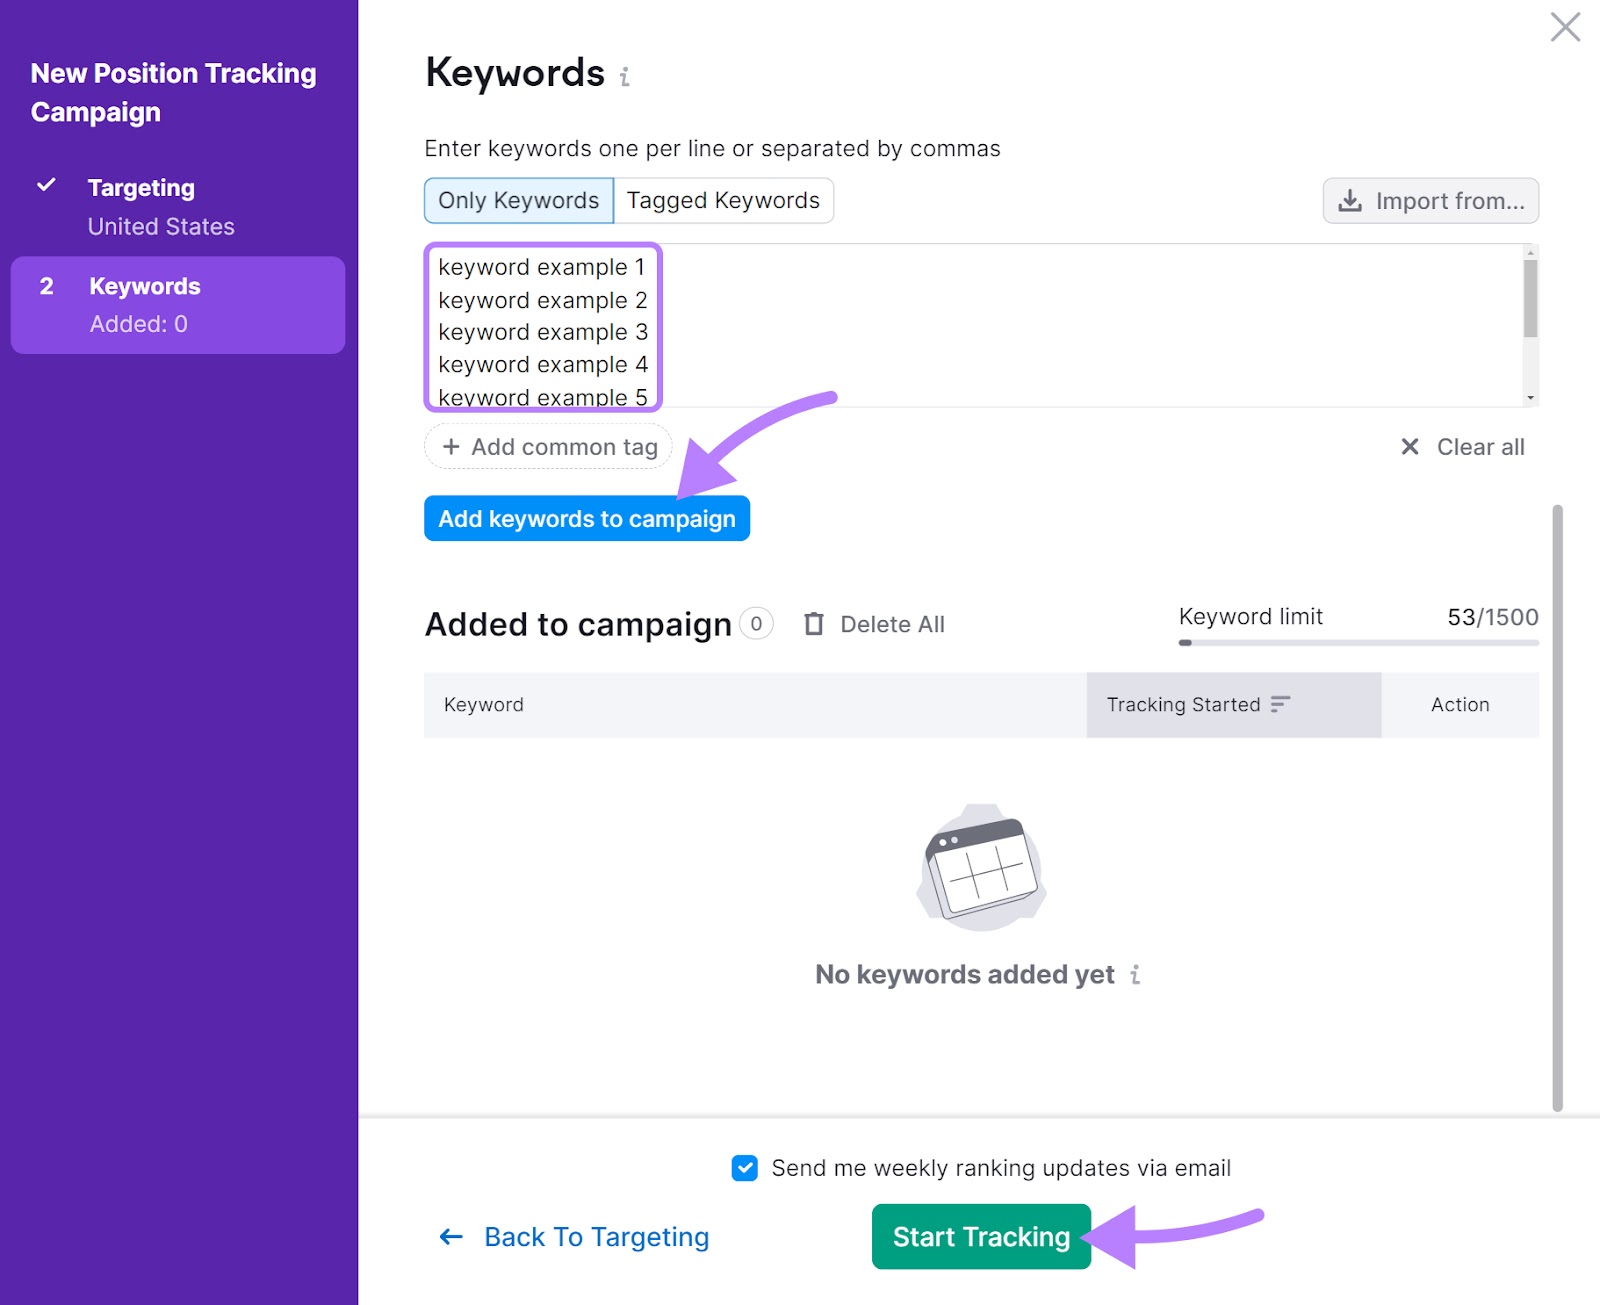
Enter the keywords you want to track, click “Add keywords to campaign,” and select “Start Tracking.”
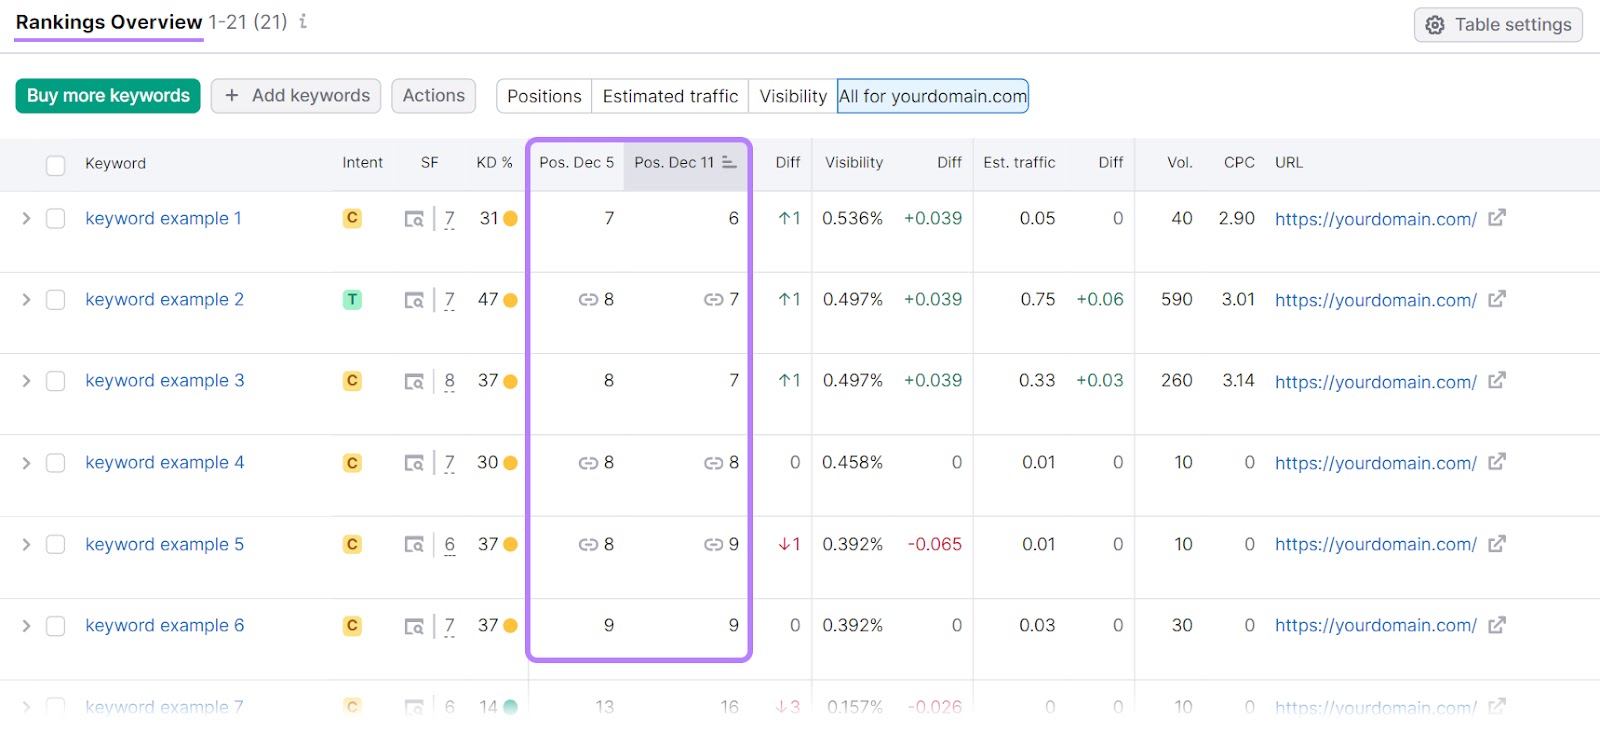
The tool will generate a list of your website’s positions in search results. And how those rankings change over time.
Position Tracking also allows you to add more keywords to your tracking campaign in the future.
Authority Score
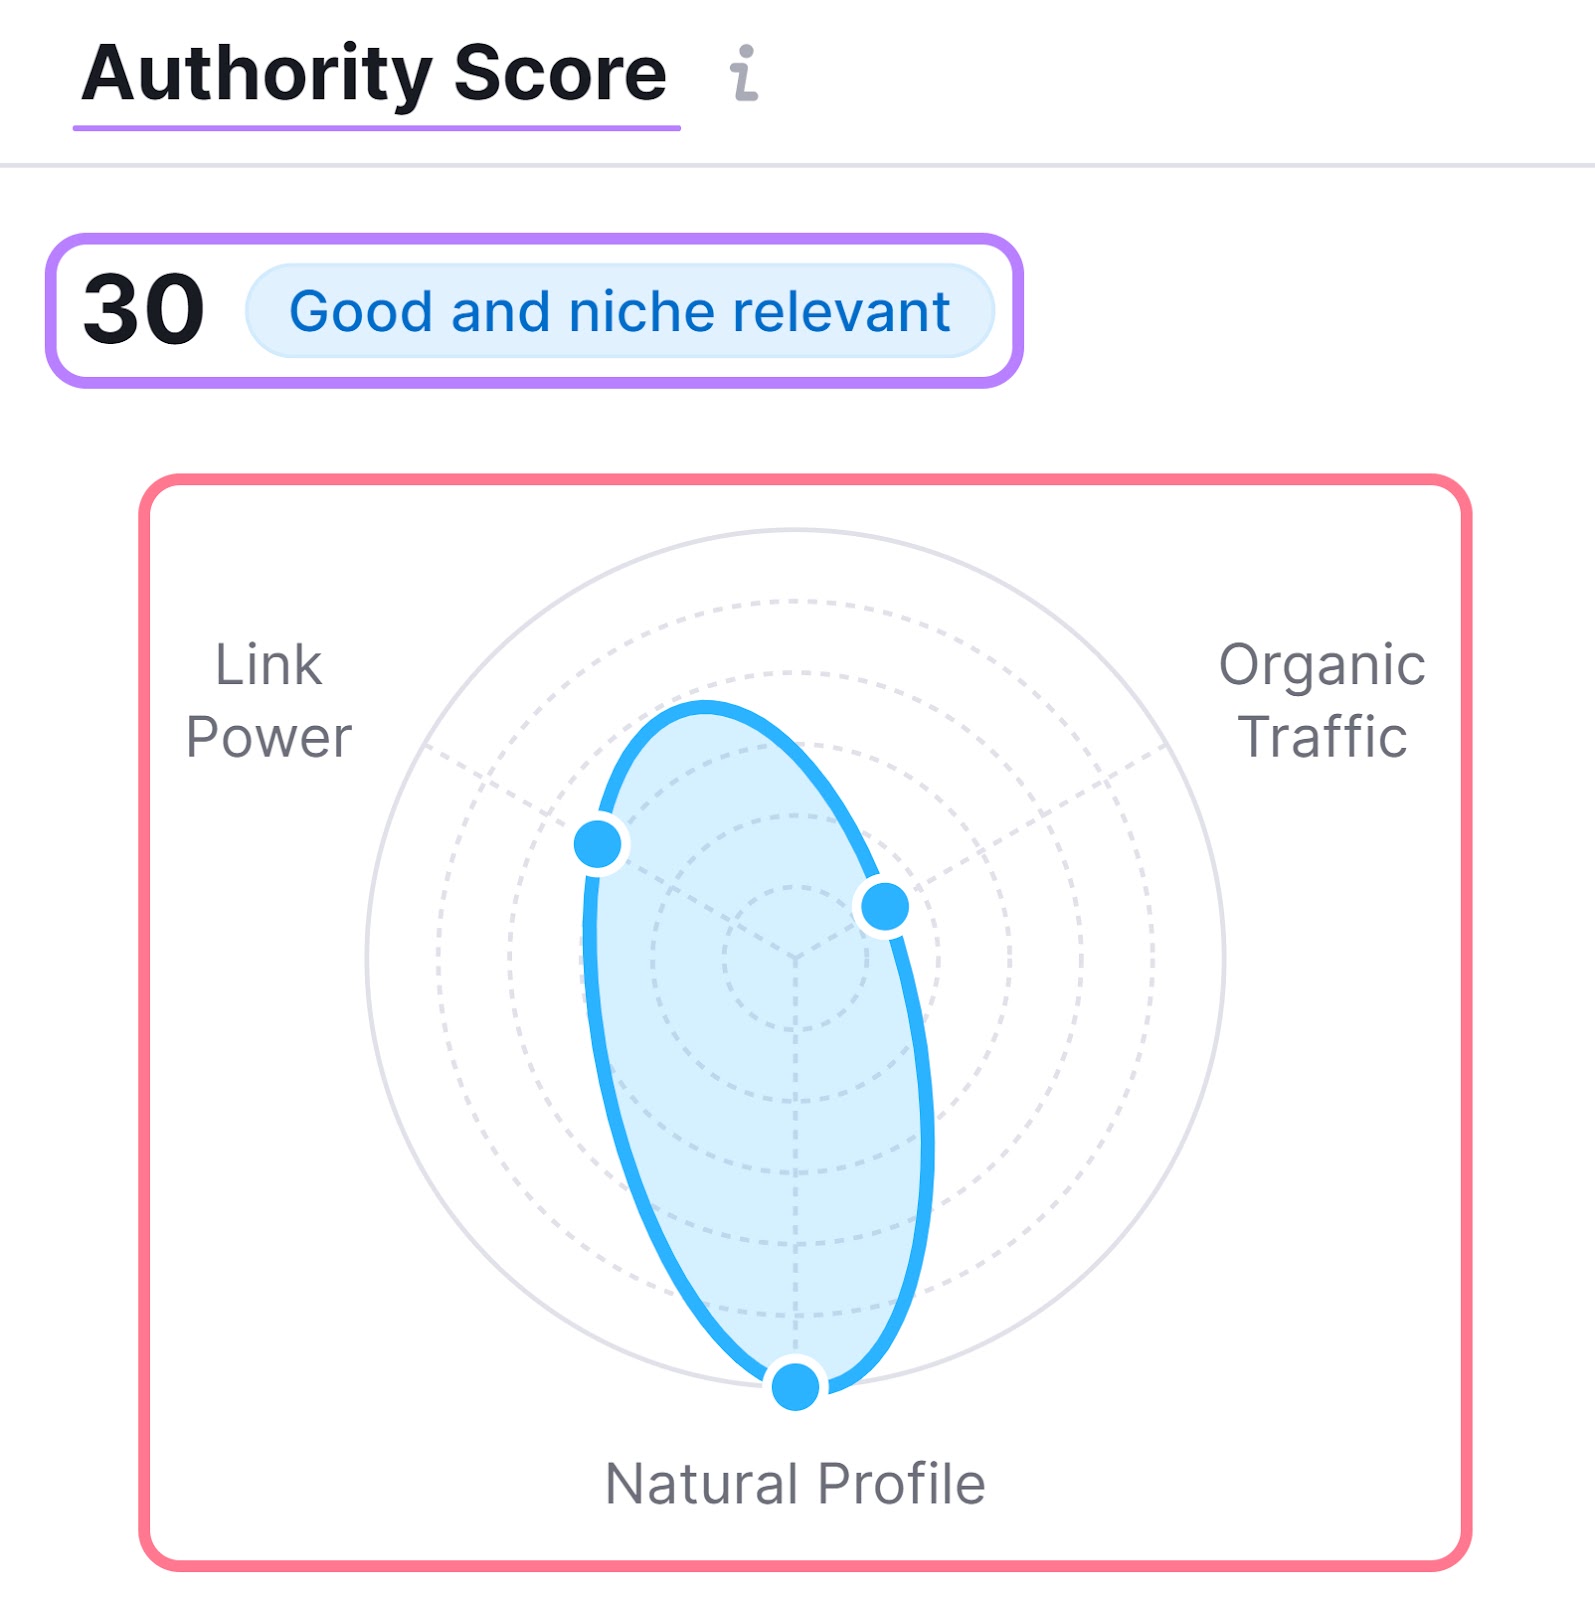
Authority Score (AS) is a Semrush metric that represents a website’s online reputation and SEO performance. It’s expressed as a number on a scale ranging from 0 to 100.
The metric takes into account these factors:
- Link power: The number and quality of backlinks a website has
- Organic traffic: Estimated monthly organic traffic
- Spam factors: Whether a website has an unnatural amount of low-quality backlinks
Check your website’s Authority Score with Backlink Analytics.
Enter your domain. Then, click “Analyze.”

You’ll see a report like this:
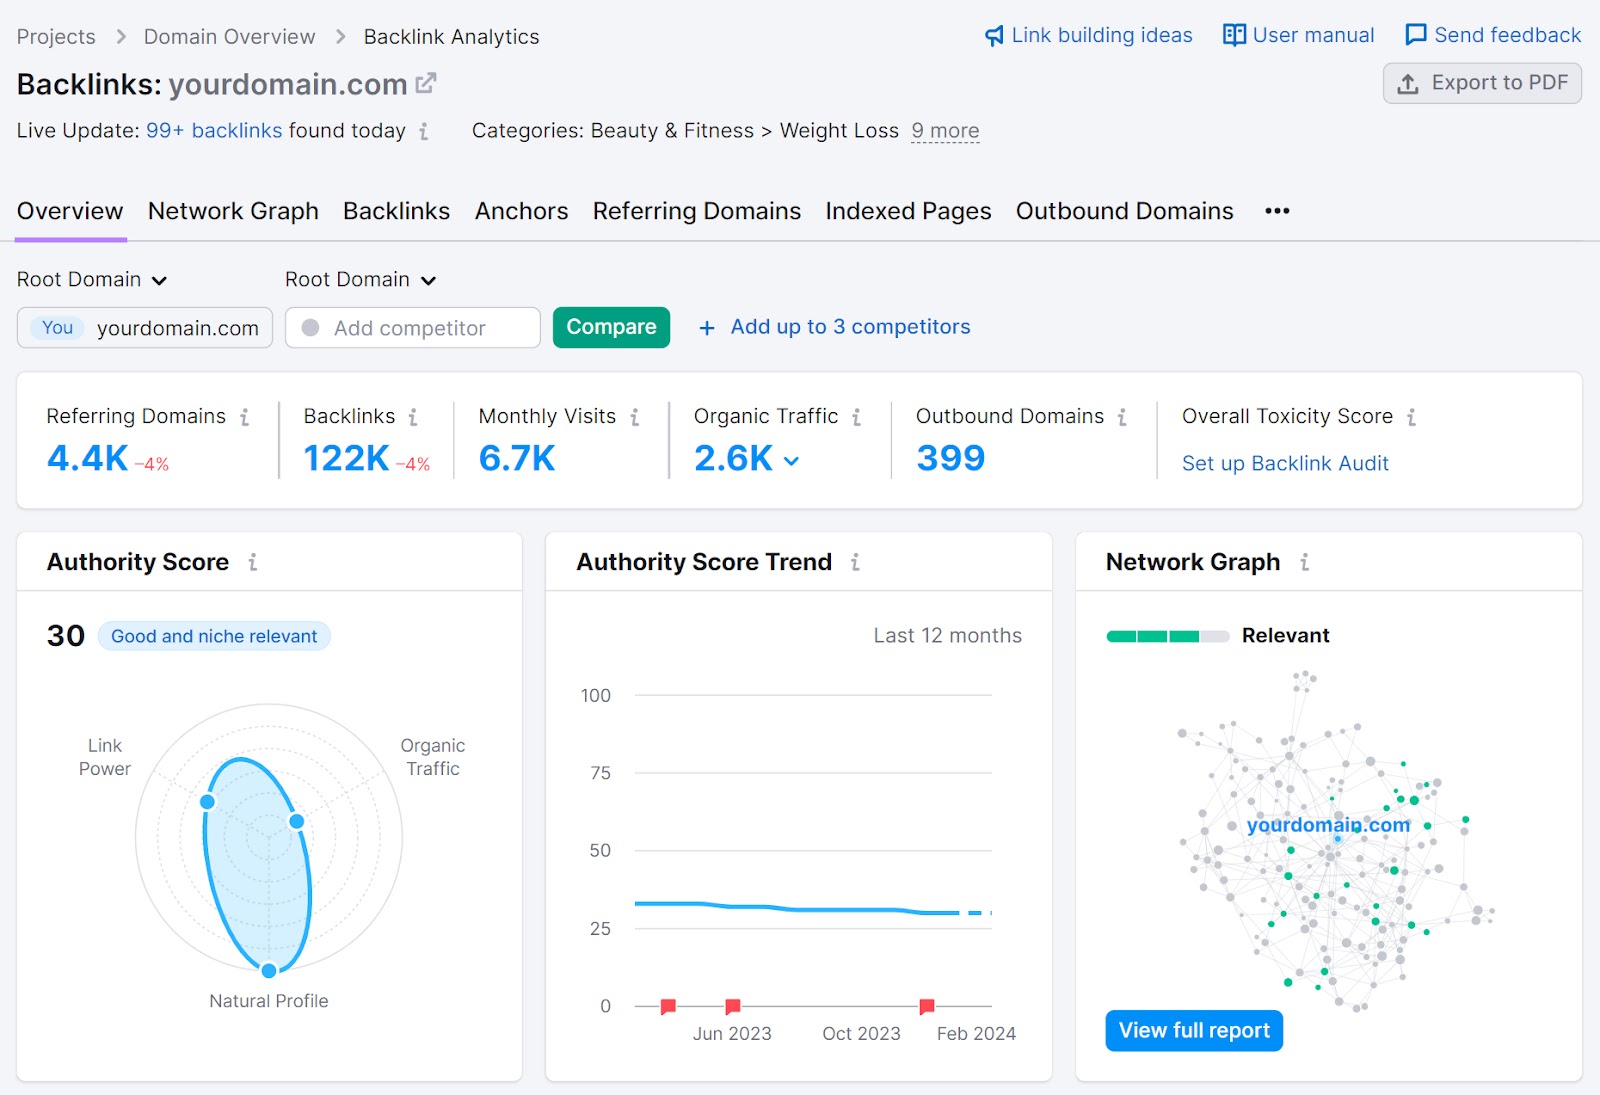
In the “Authority Score” section, you’ll see the number grading your website and a graph analyzing the three contributing factors (link power, organic traffic, and spam factors).
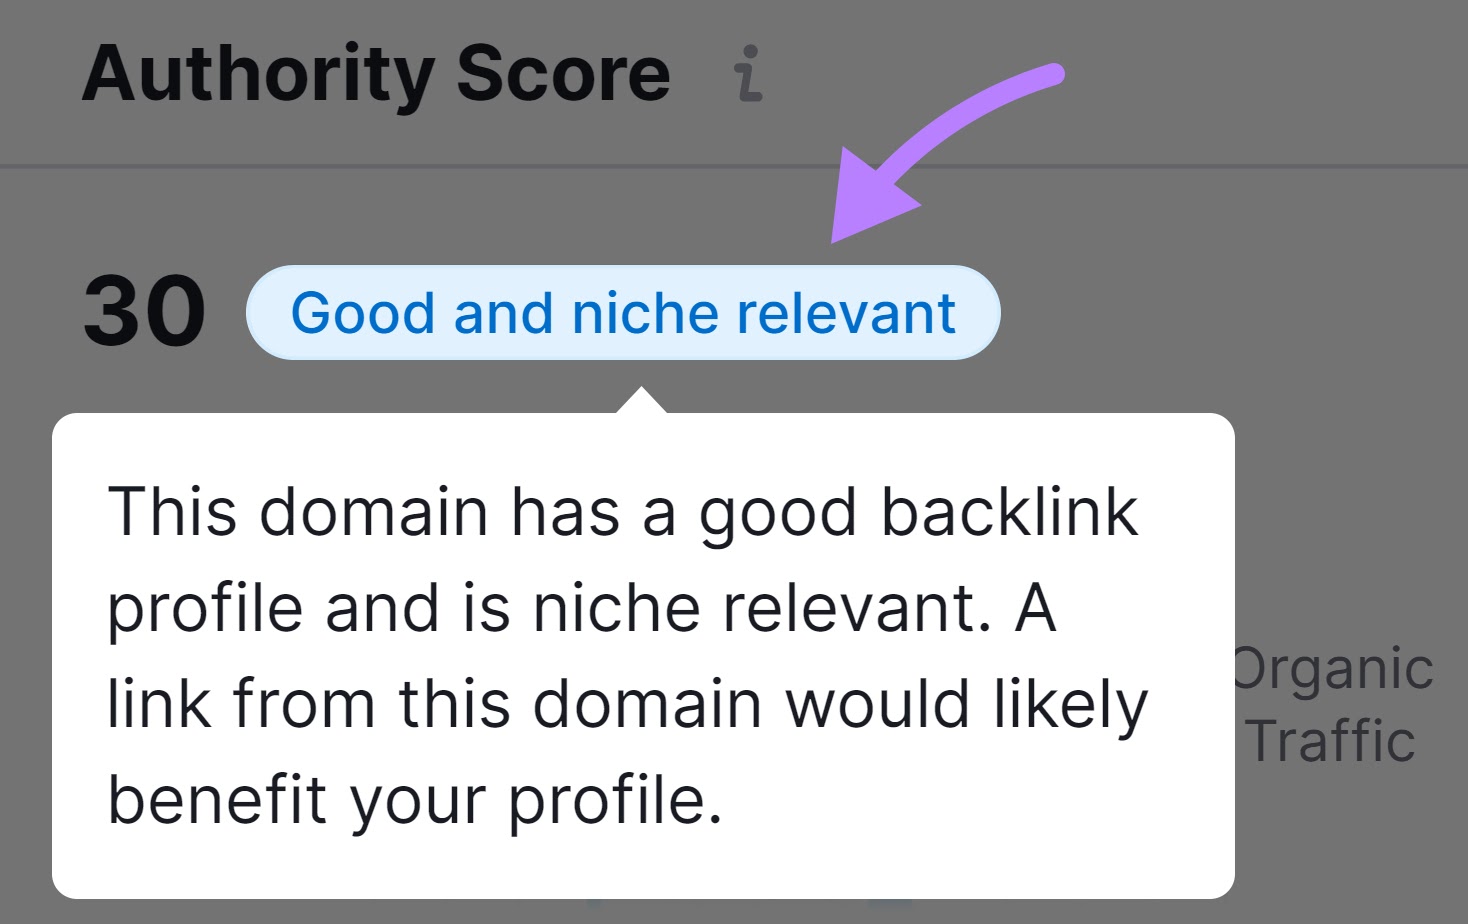
Next to the number, there’s a blurb that will give you more information about your domain. Hover over it to see more.
Why is AS helpful?
Because it helps you understand your chances of ranking highly. And whether you need to engage in activities like link building. Which we’ll go over next.
Backlinks
Backlinks are links from other websites that point to your website. And it’s one of the key factors Google uses to evaluate and rank websites in search results.
Check the number of backlinks any website has with Backlink Analytics. You can even evaluate a specific page like a valuable resource you’re hoping will attract attention as part of a link building campaign.
Enter the URL of the page you want to check. Then, click “Analyze.”

This URL has 192 backlinks from 99 referring domains.
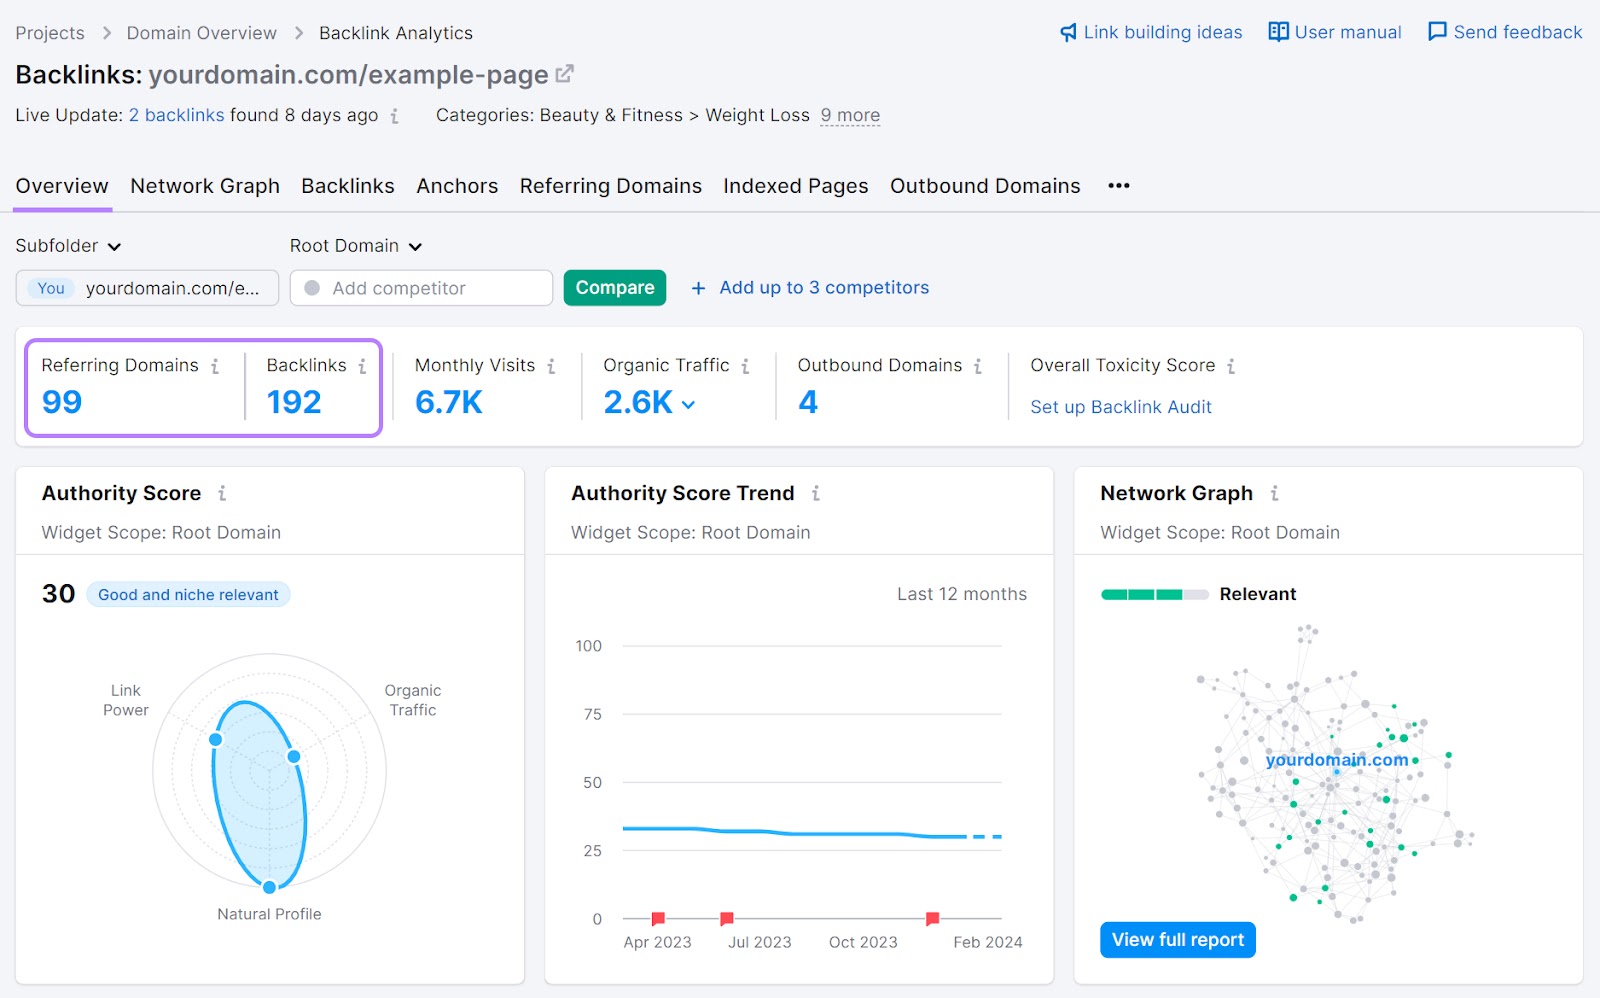
Having a higher number of backlinks than referring domains means that some of these sites link to your page more than once.
If a page you created for PR and link building purposes isn’t getting links from topically relevant and authoritative websites like this, you may need to engage in direct outreach or another link building tactic.
Mentions
Mentions are whenever your brand is mentioned online—on social media and other websites.
Keeping track of brand mentions can help you understand how much brand awareness you have. And gauge the sentiment around your business.
Easily stay on top of your mentions with Brand Monitoring.
Go to Brand Monitoring, click “New query,” then select “Brand.”
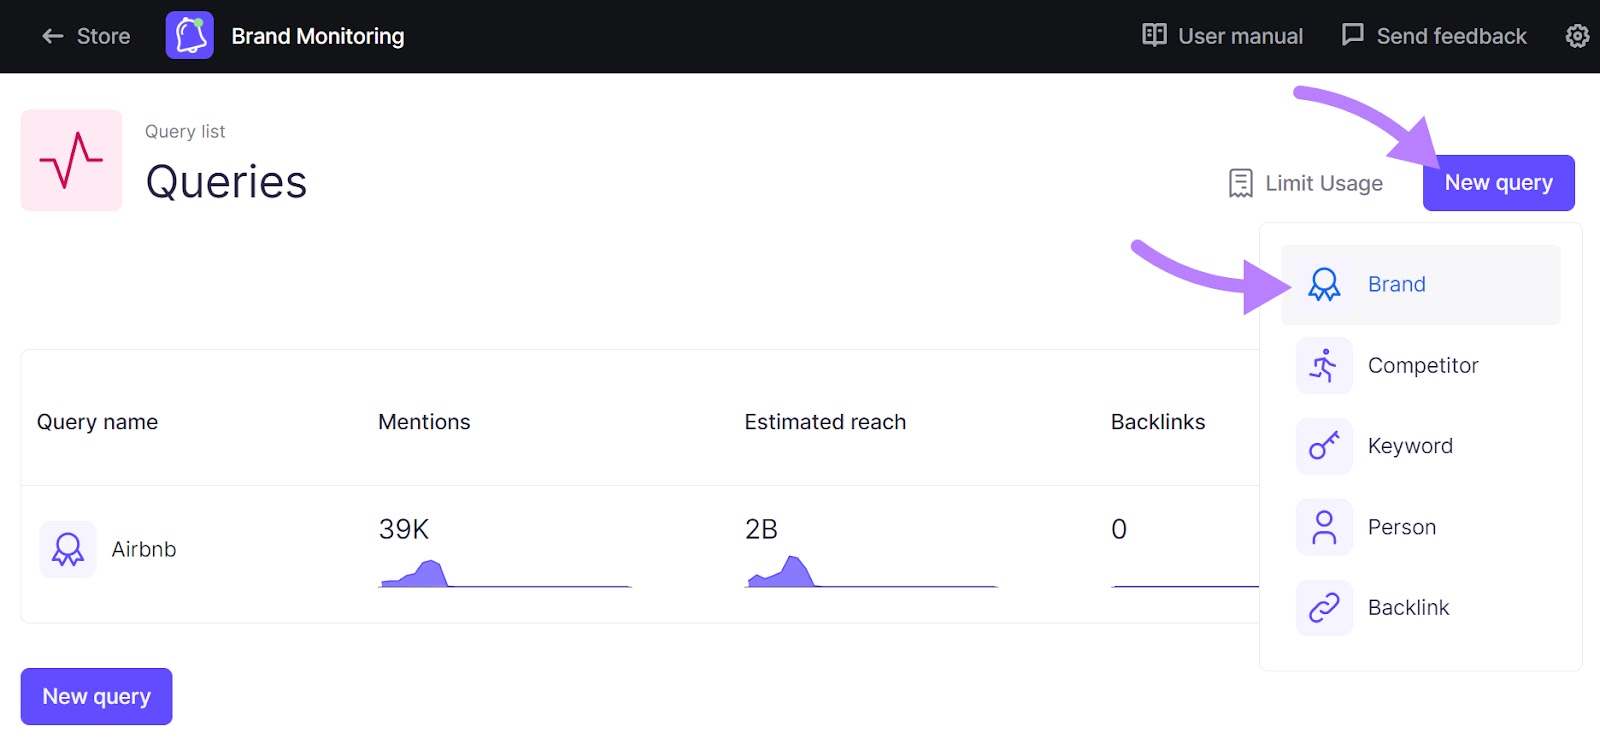
Enter your brand name and an email address where you want to receive notifications about new mentions.
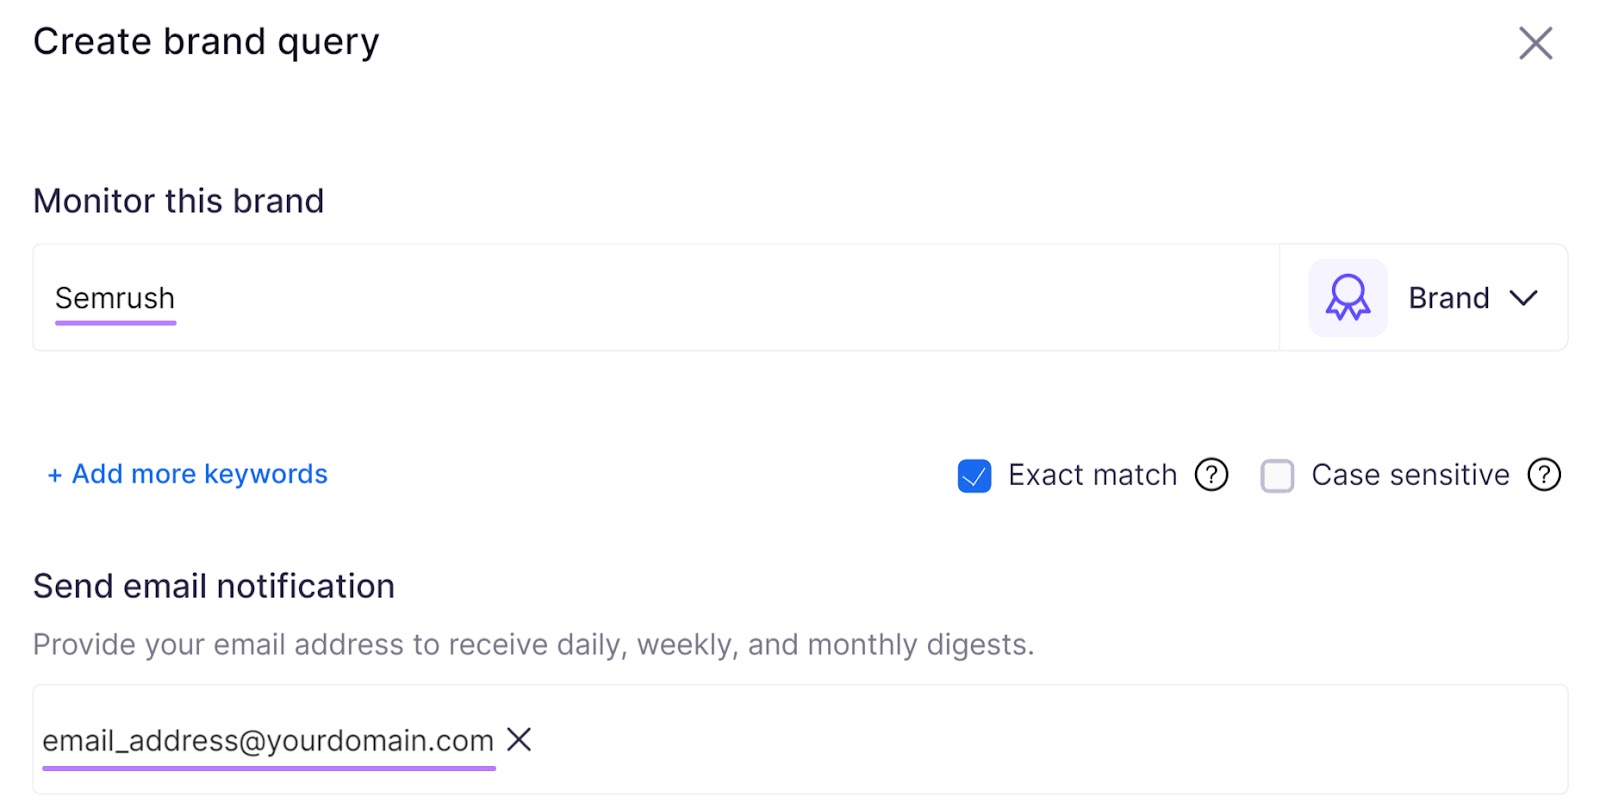
Scroll down to fill out other relevant information.
For example, you can add your domain to track backlinks. Or specify the country where the mentions are coming from.
Next, click “Create query.”
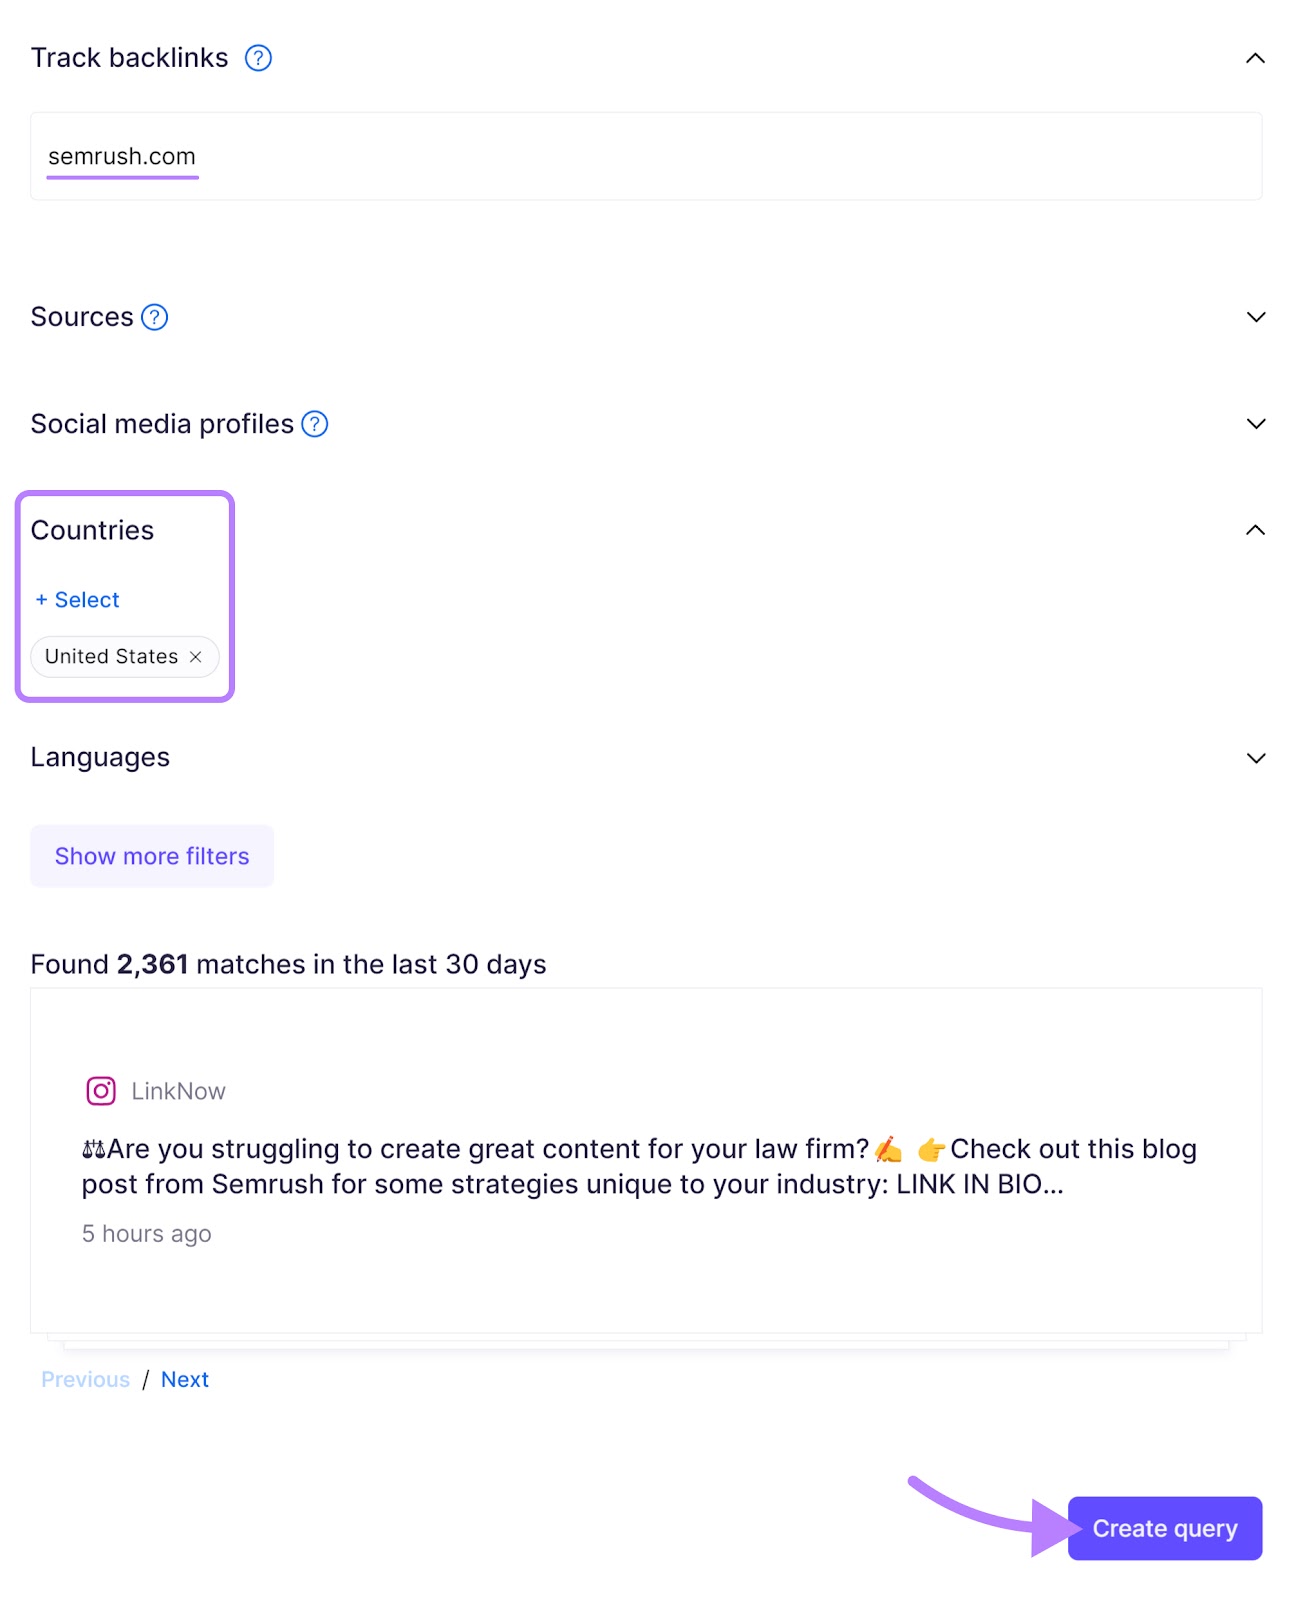
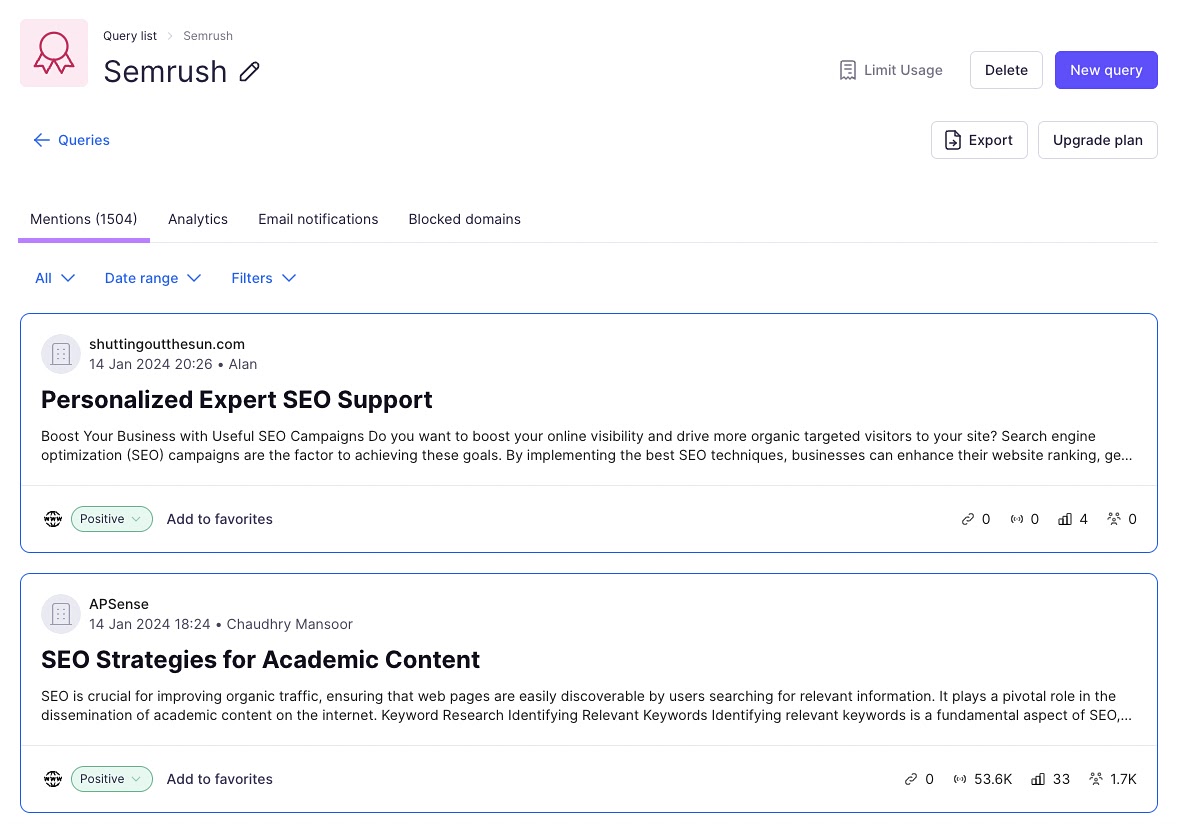
The tool will generate a report with existing online mentions of your brand.
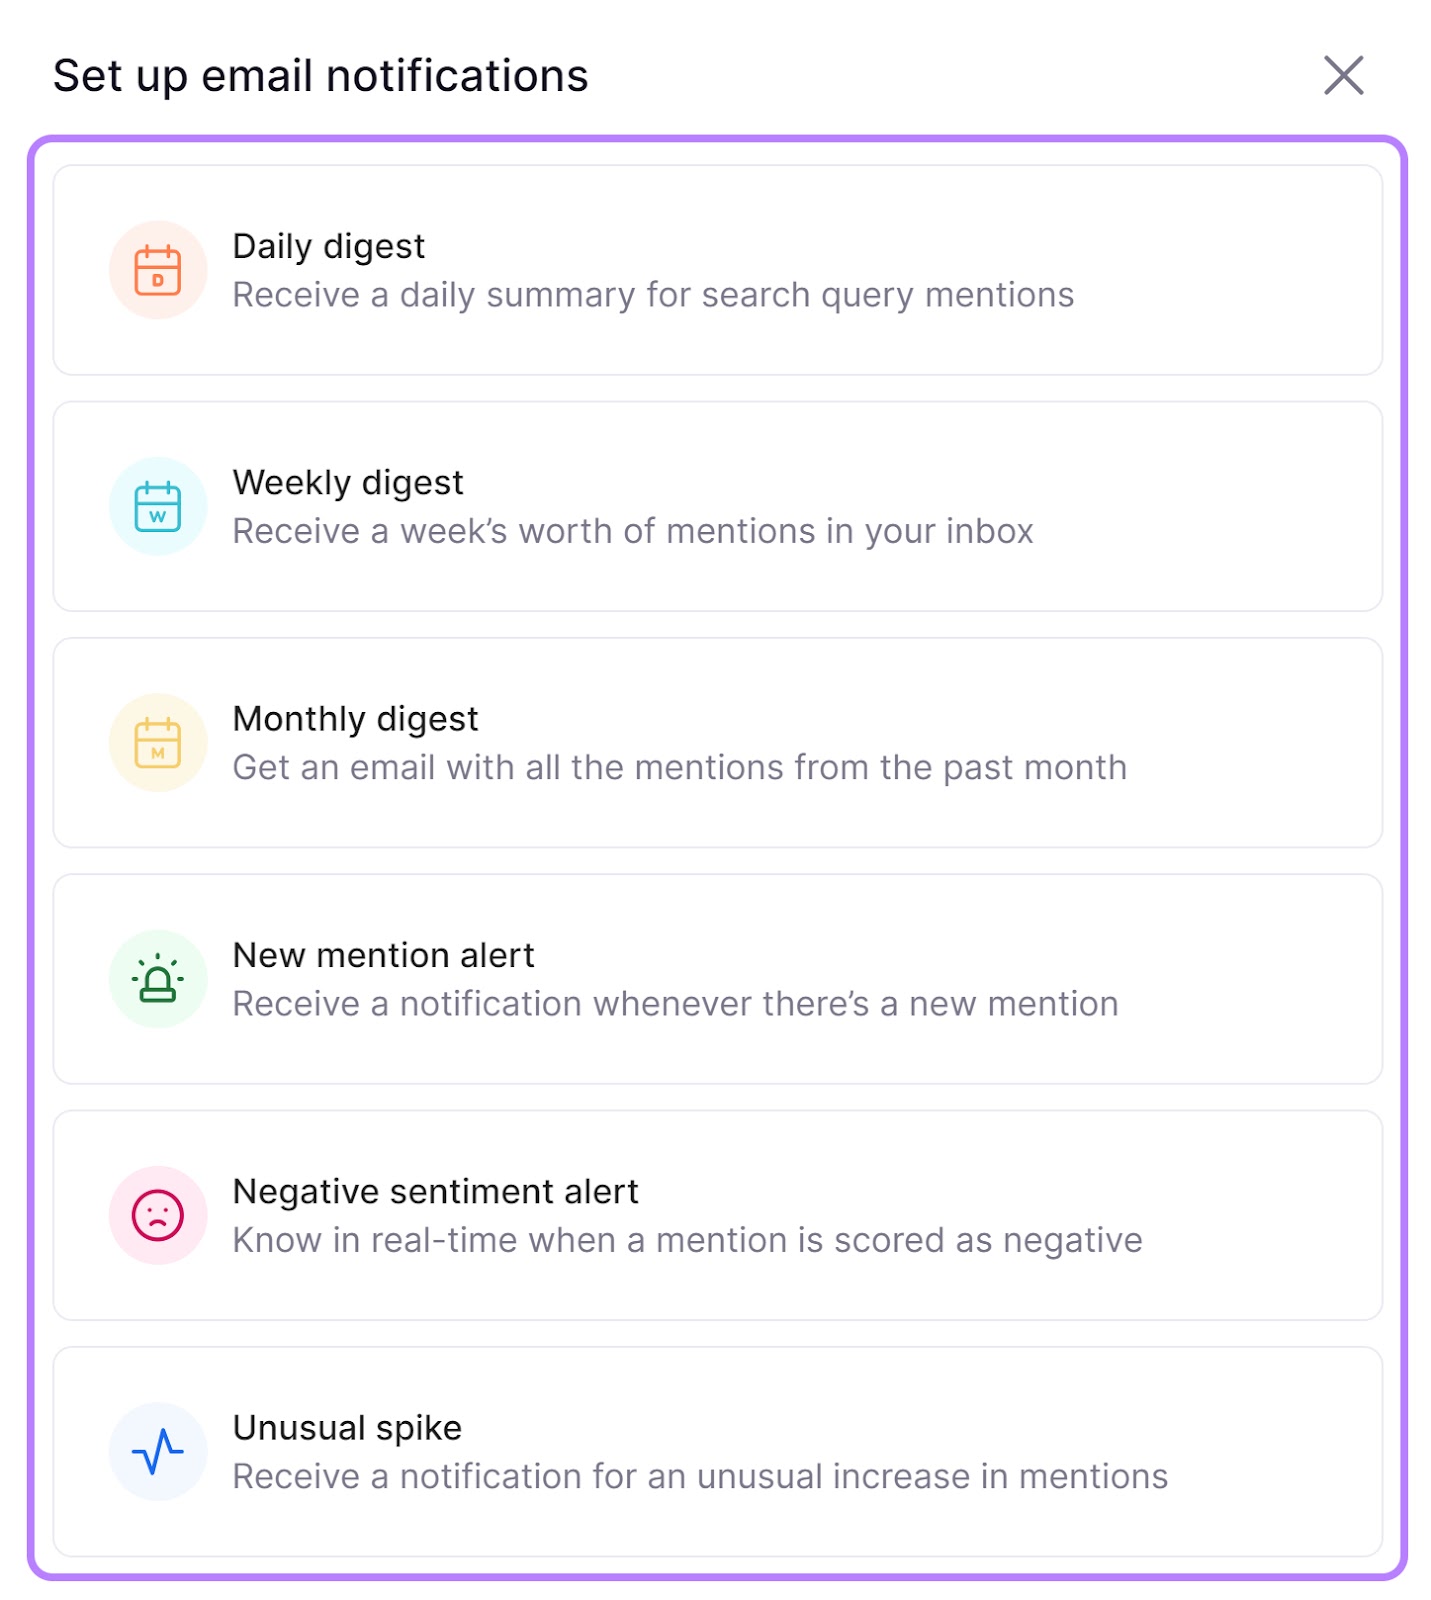
And you’ll receive emails with new mentions. Which you can set to be daily, weekly, monthly, etc.
Revenue-related metrics show whether your content is supporting your business’s financial goals.
Number of New Leads
A sales lead is a potential client who’s shared their contact details with you. They could do that by signing up for a free trial, downloading some free material on your website, inquiring through a contact form, etc.
Generating new leads through your content is a good sign you’re on the path to getting more customers.
Track your leads using ImpactHero.
You’ll easily be able to see how many users you’ve converted in a dashboard like this:
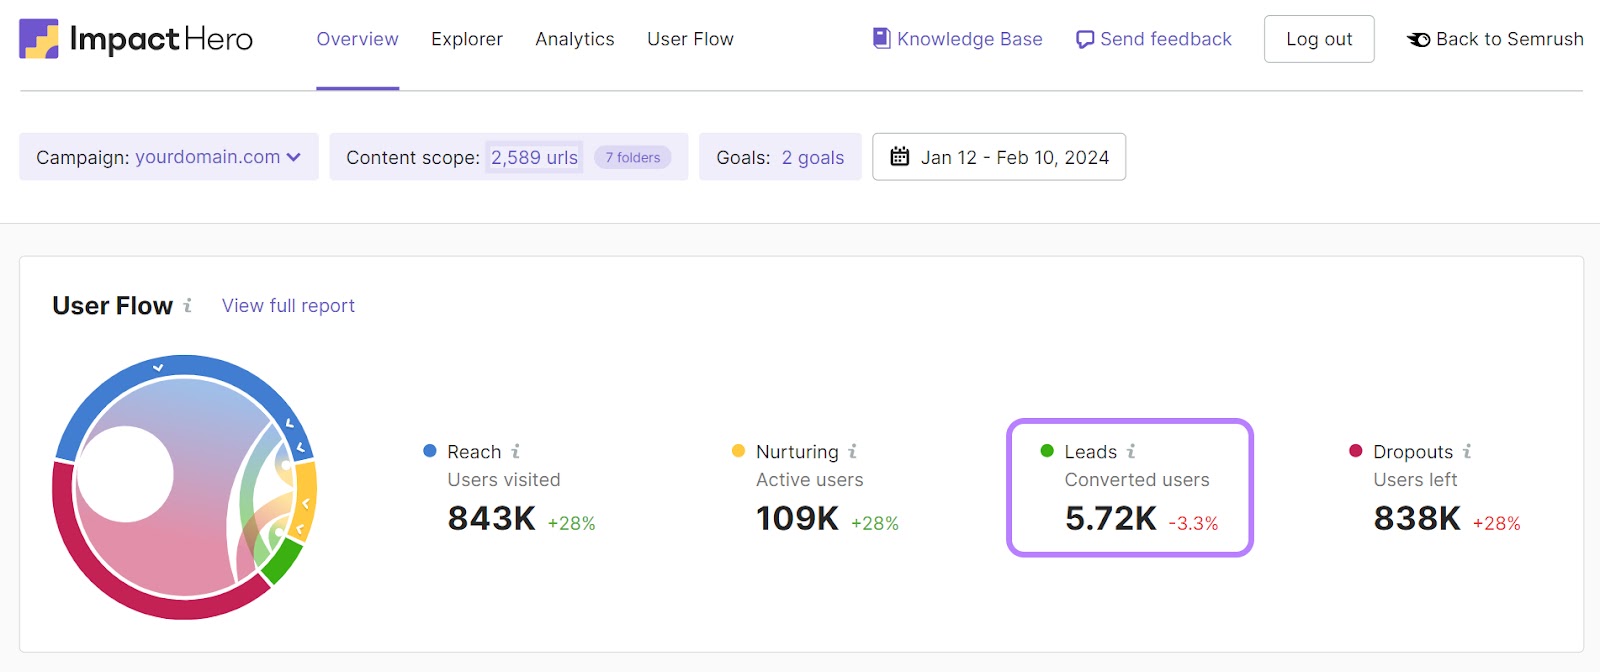
ImpactHero can also help you understand what kind of content performs best at different stages of the buyer’s journey. Including which pieces bring in the most leads.

Conversion Rate
Conversion rate represents the percentage of users that land on your site and complete a desired action (e.g., buy, download, click, sign up, etc.).
Measuring conversion rate is essential to understanding how effective your content marketing funnel is. And whether there’s room for improvement.
You can track conversion rates in Google Analytics. You’ll need to set them up first, so follow these steps if you haven’t done this yet.
Now, let’s explore where to find conversions in GA4.
In the left-hand menu, click “Reports” > “Engagement” > “Conversions.”
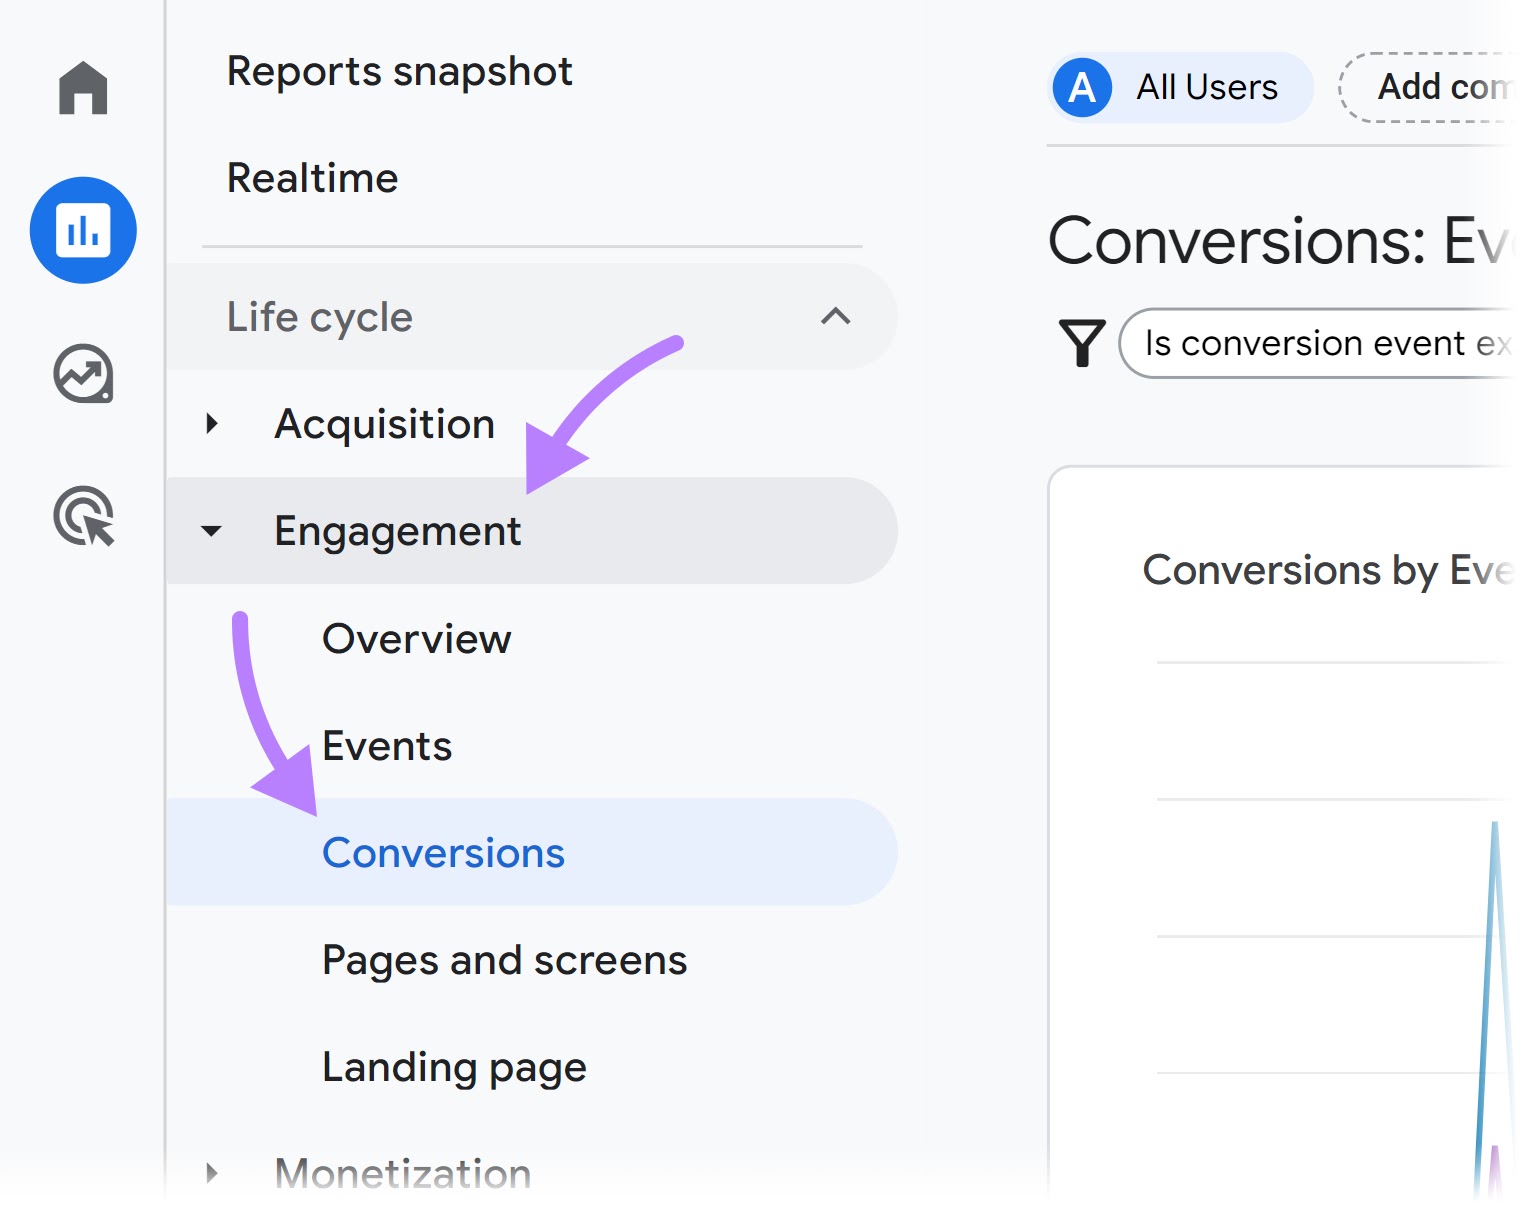
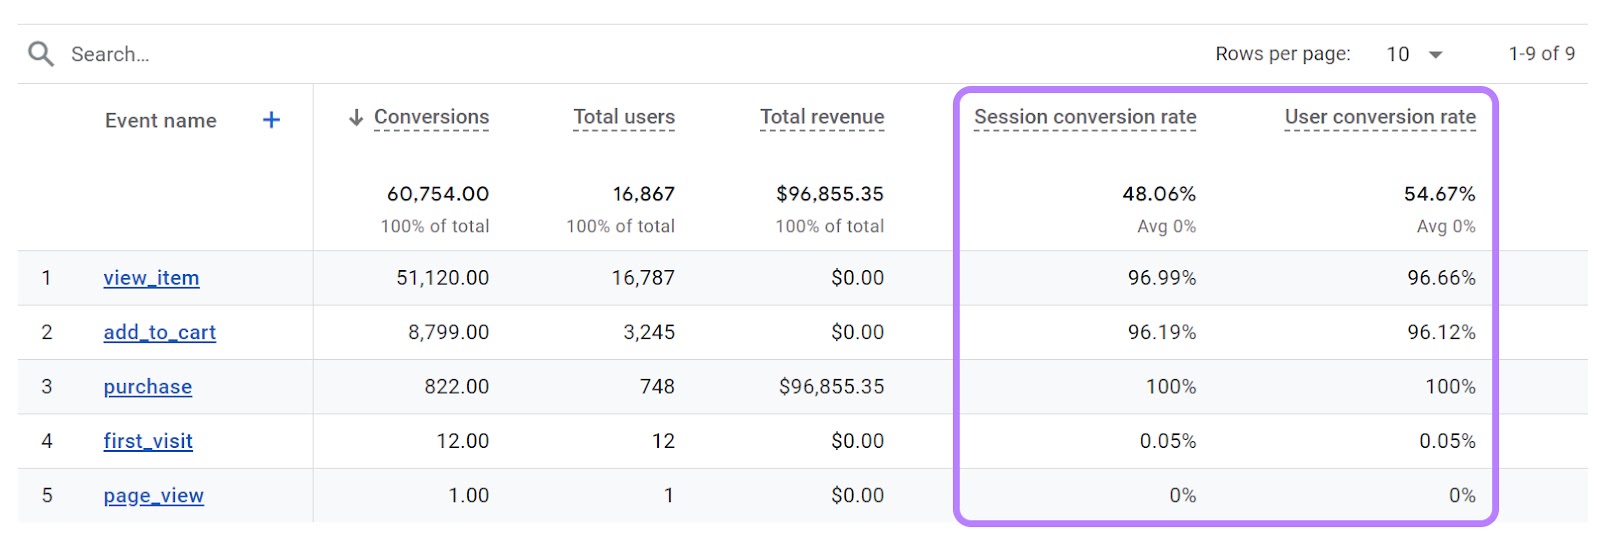
You’ll see a breakdown of all the different conversion events you’re tracking.
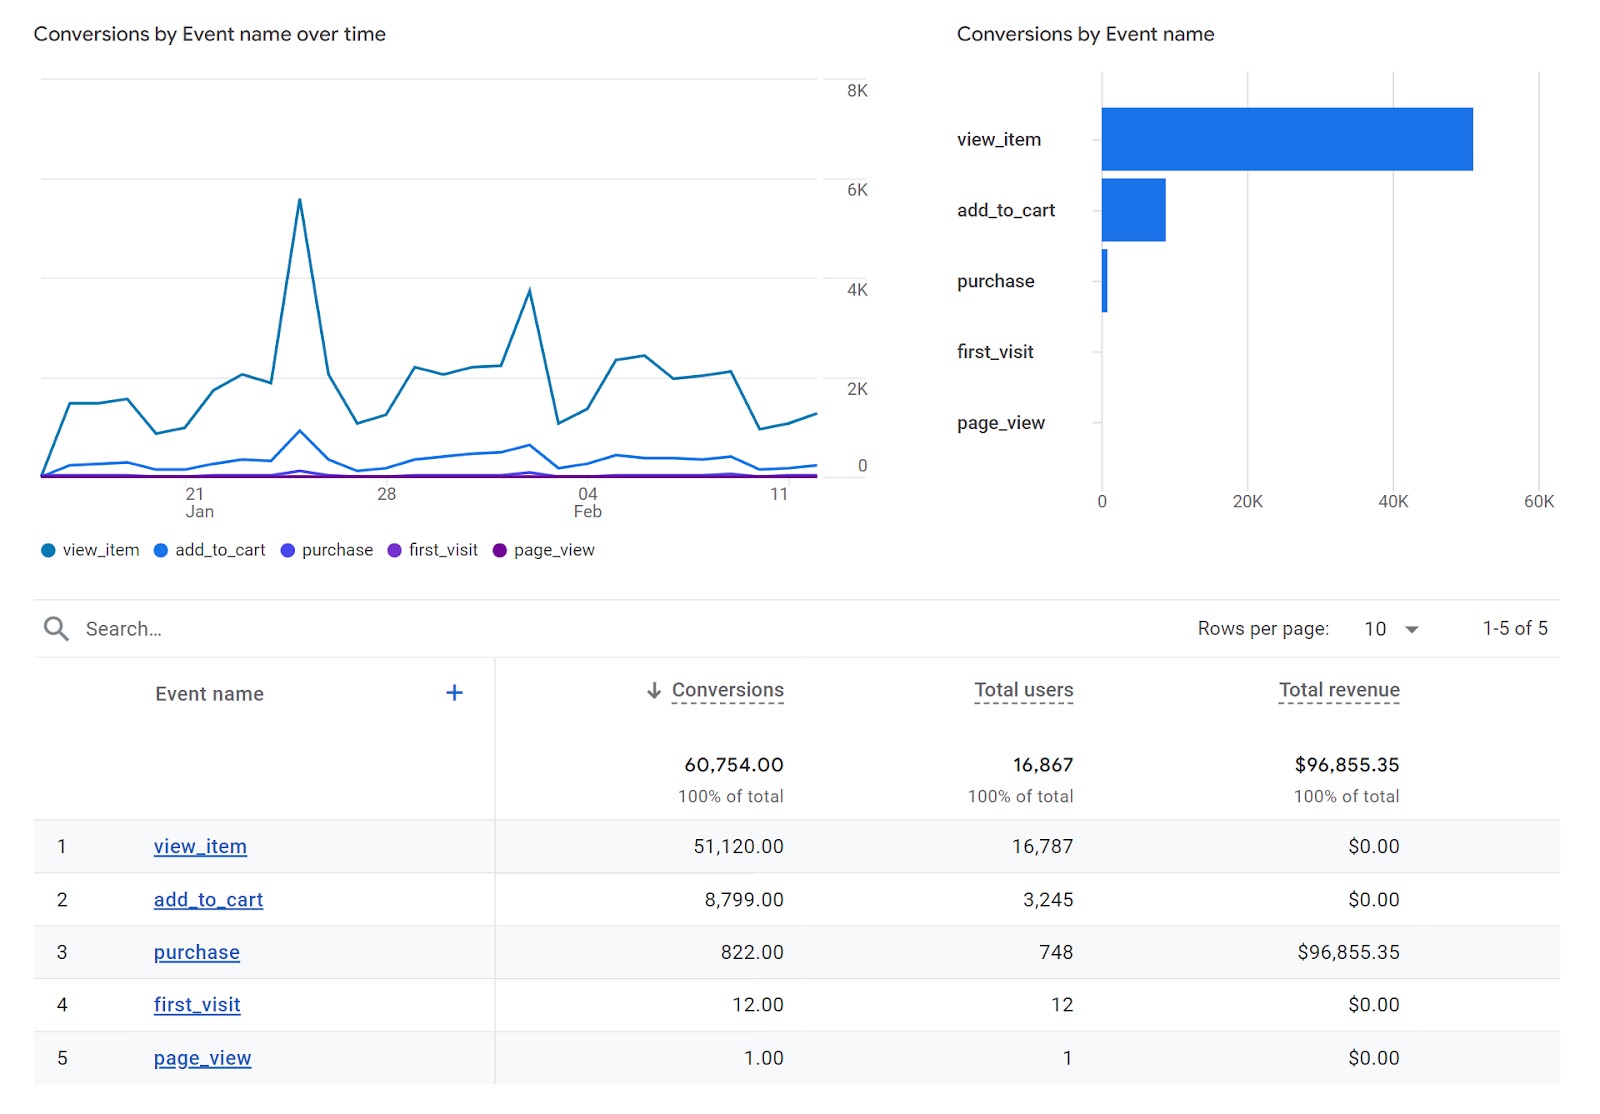
The conversion rate won’t be available by default, but you can add it to the report if you have Editor or Administrator access to the GA account.
Click on the pen icon in the top right corner to customize the report.

Click “Metrics.”

Select the “Add metrics” field and look for “conversion rate.”
You’ll notice there are two metrics:
- Session conversion rate: Shows the percentage of converted sessions
- User conversion rate: Shows the percentage of converted users
Add them both and click “Apply.”
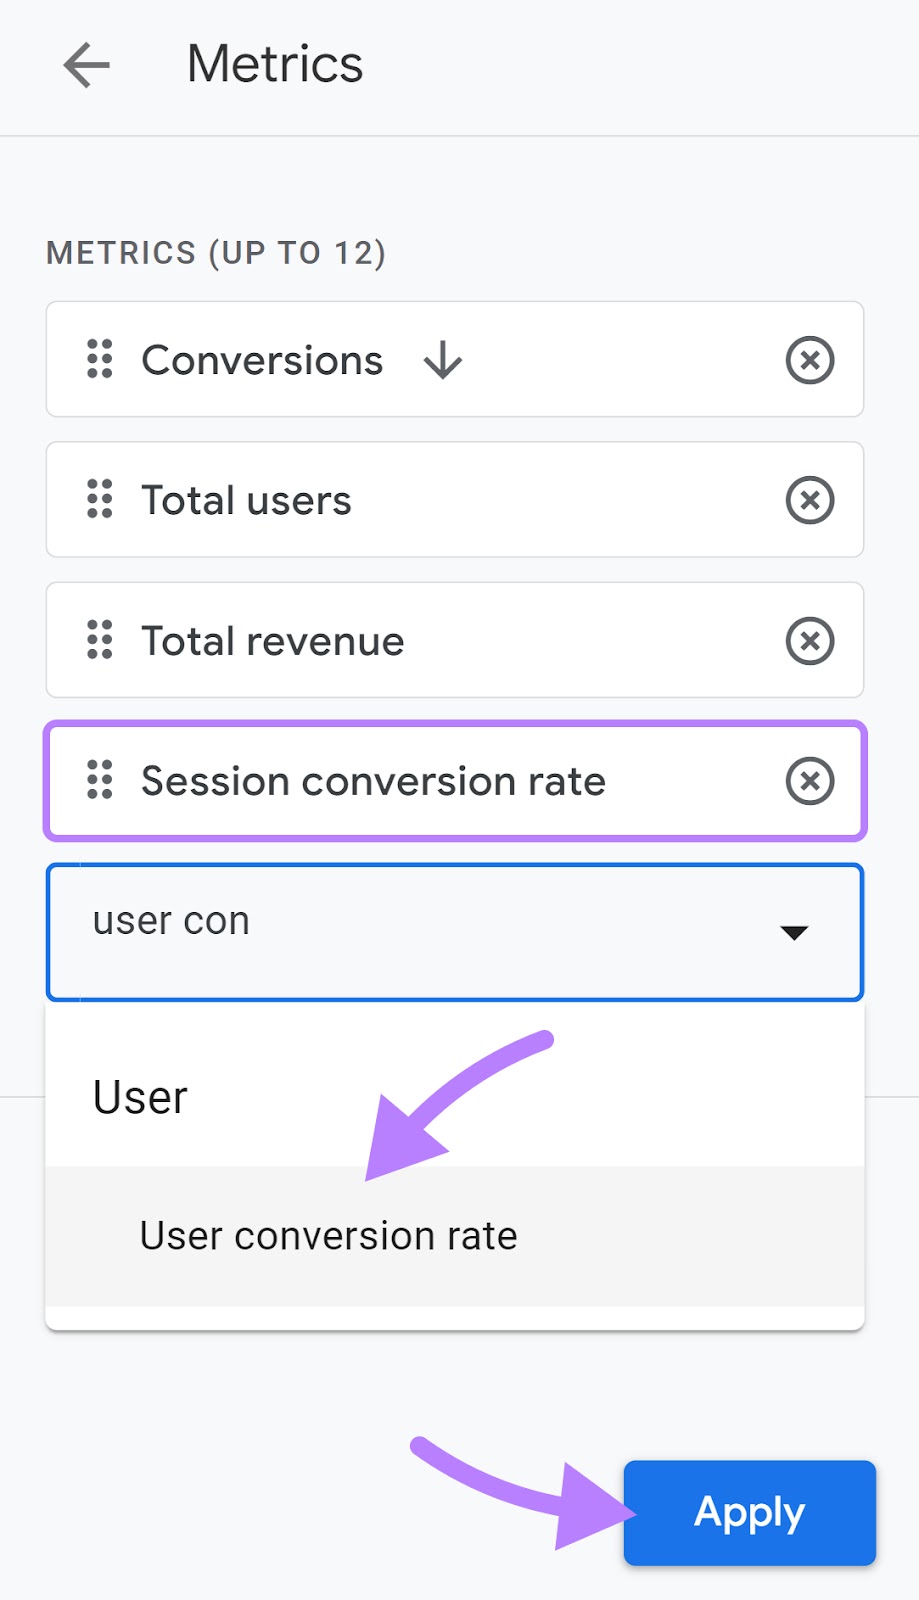
You’ll now be able to see these two metrics in your report.
Content ROI
Content return on investment (ROI) represents a correlation between the revenue you gained from content and the resources you invested in content production and distribution. To help you see whether your content marketing efforts are paying off.
If your ROI is high, it can help you advocate for more resources. And if it’s low, take action toward maximizing results.
The most common formula for calculating content ROI is:
Content ROI = ((Return – Total Content Investment) / Total Content Investment) x 100
The final number is represented as a percentage.
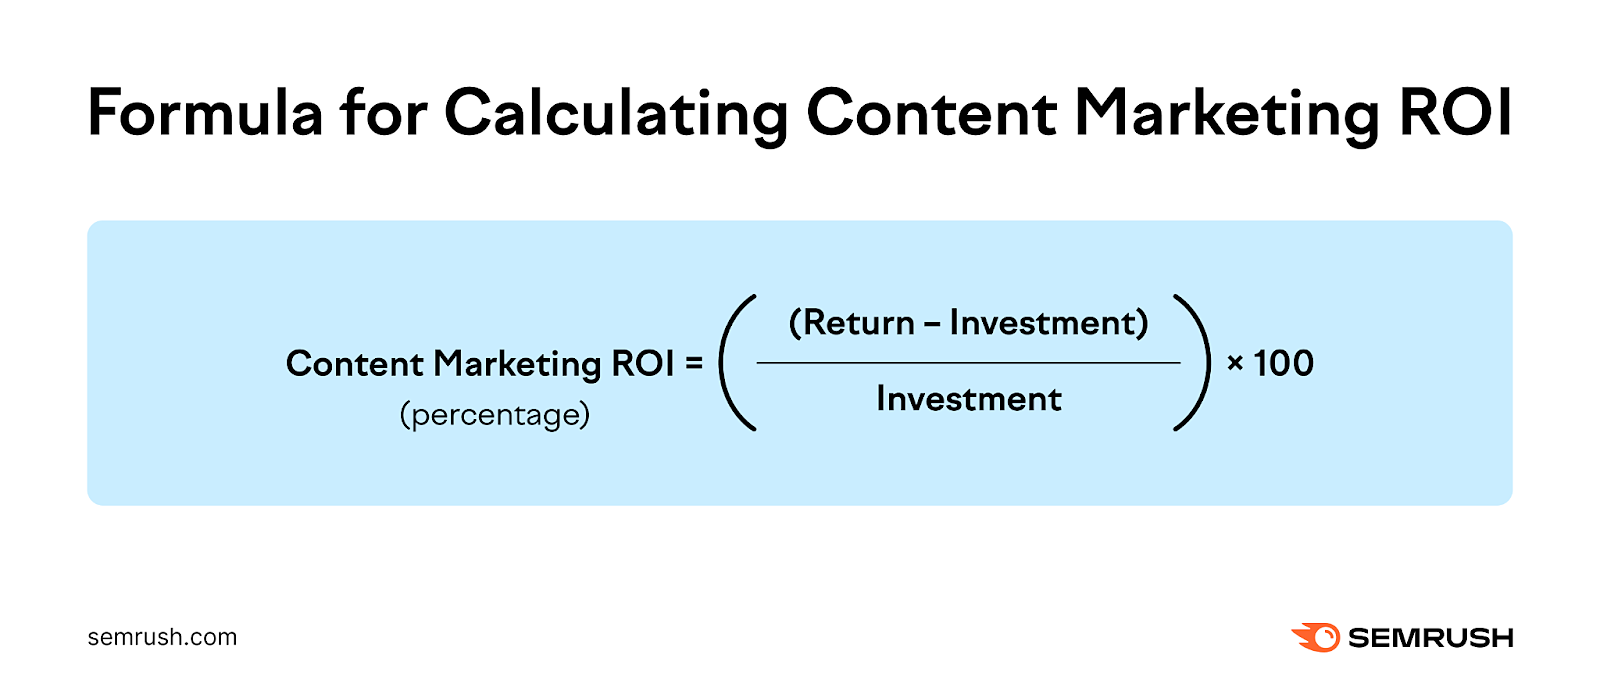
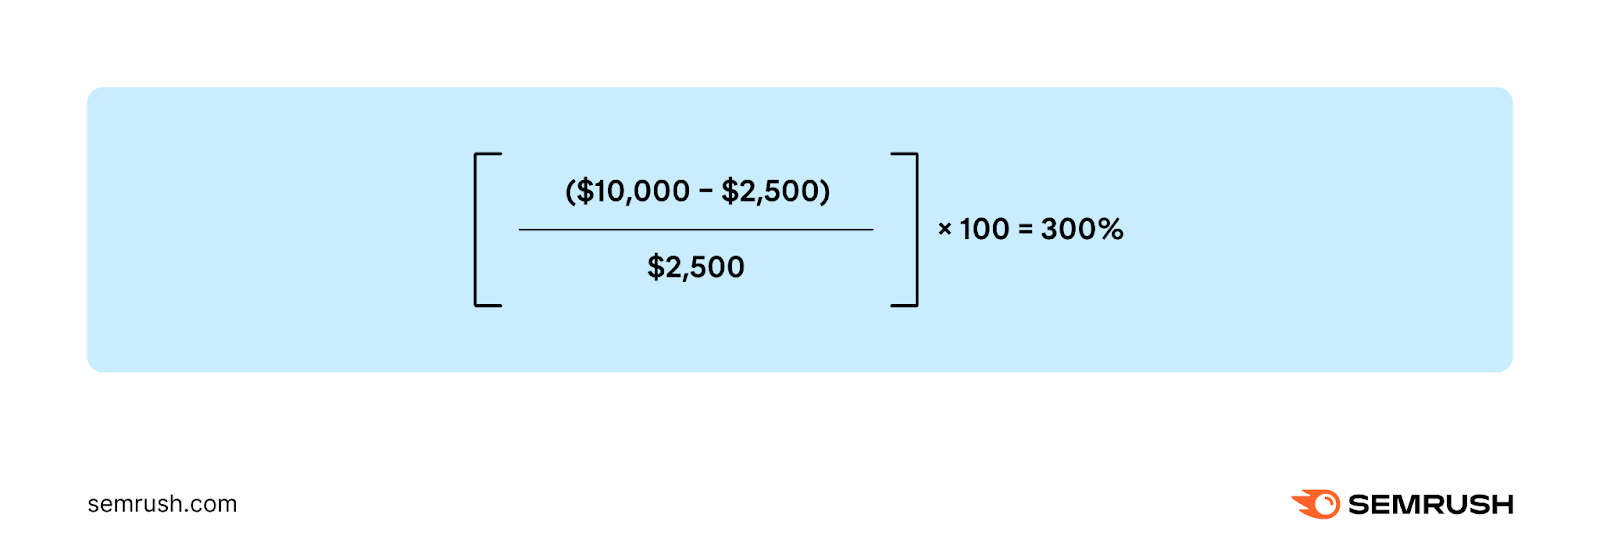
Let’s say your blog content generated $10,000 in sales, and you invested $2,500 in content production and distribution.
That means your blog content ROI would be 300%.
Content Production Metrics
Content production metrics help you optimize your editorial processes.
Time to Publish
Time to publish refers to the time it takes from coming up with a content idea to the publication of the content piece.
Monitoring time to publish helps content managers stay on top of their workflows and identify potential bottlenecks in content production.
If it takes a long time to publish a piece, there could be issues within the workflow you need to identify.
For example, the briefs could be unclear, the topics may be challenging, or there might be specific team members who are late with their delivery.
Keep in mind this metric will greatly depend on your content editorial standards, the number of revisions, and other factors. There’s no specific number to aim for, but tracking it will help you identify specific situations to address.
Here’s an example of what a workflow might look like:
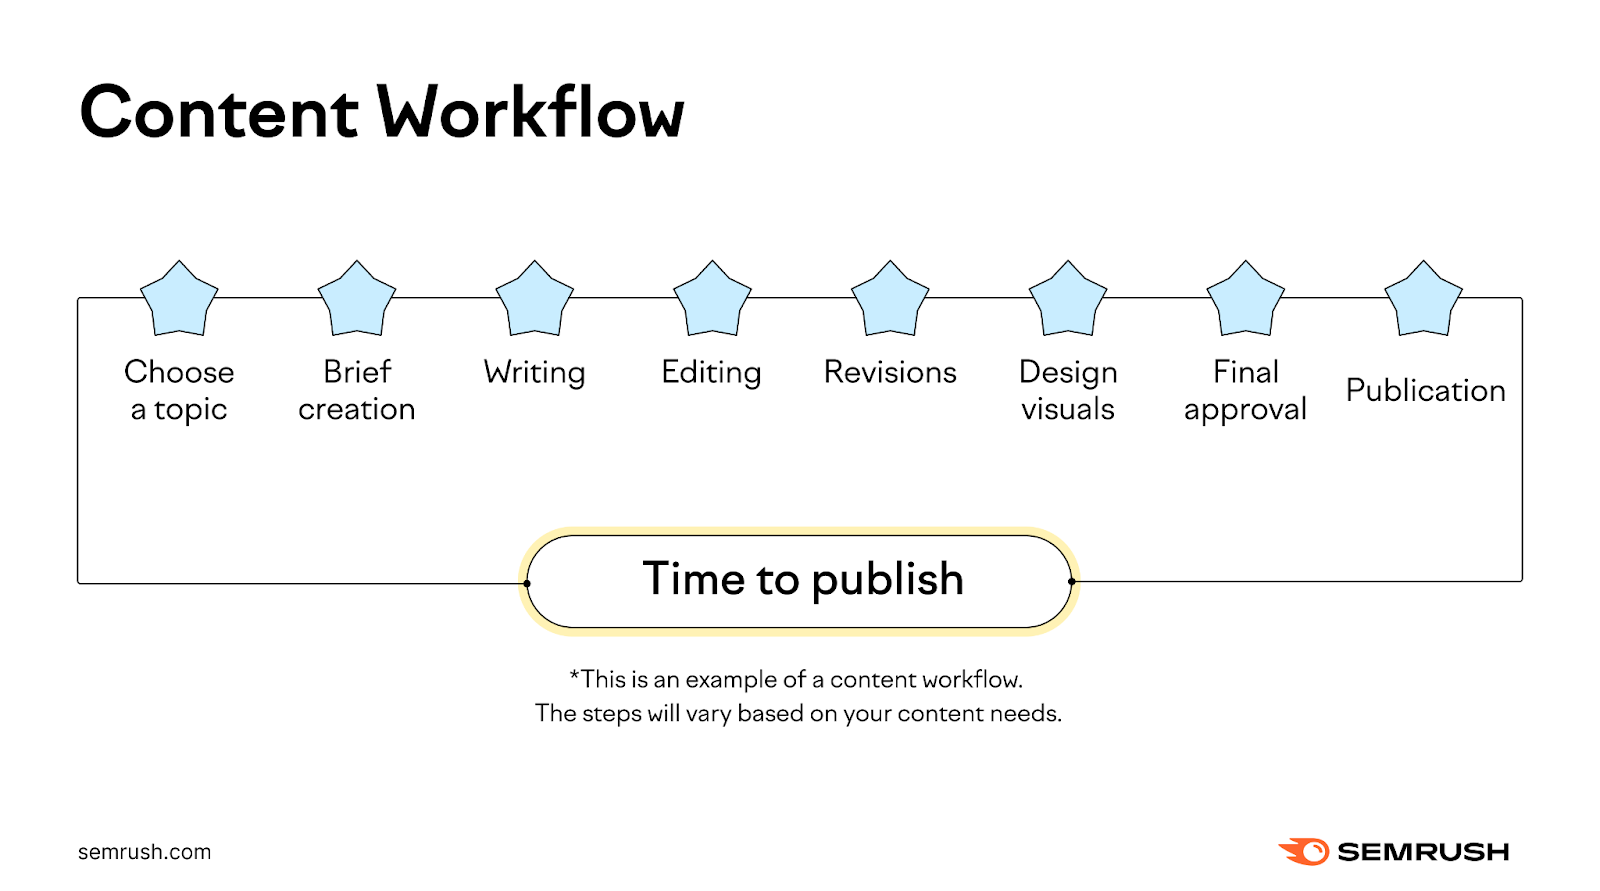
As you can see, there are numerous steps where slow-downs could occur.
Production Cost
Production cost refers to how much money you allocate for creating content. And you can measure it for all your content as well as for specific pieces.
Measuring production cost helps with calculating ROI. And is essential for making data-driven decisions about which content to invest in.
For example, let’s say an article costs a lot to create but doesn’t drive the desired results. You might want to have a look at similar topics in your content strategy and evaluate whether it makes sense for you to cover them.
Distribution Cost
Distribution cost refers to how much money you’re spending to distribute and promote your content.
This cost could involve paid ads on Google and Meta platforms, distributing press releases to a PR wire network, collaborating with influencers who promote your content, and a lot more.
Tracking distribution costs is critical for calculating ROI. And lets you see whether certain channels are more cost-effective than others.
Engagement Metrics
Engagement metrics give you insights into whether your content is resonating with your audience.
Average Engagement Time
Average engagement time shows how long an active visitor (someone whose primary focus is on your website) stays on your site.
A longer average engagement time can indicate that your content resonates with your target audience. And that it matches search intent.
You can view this metric in Google Analytics.
Go to your GA4 account. And then click “Engagement” > “Overview.”
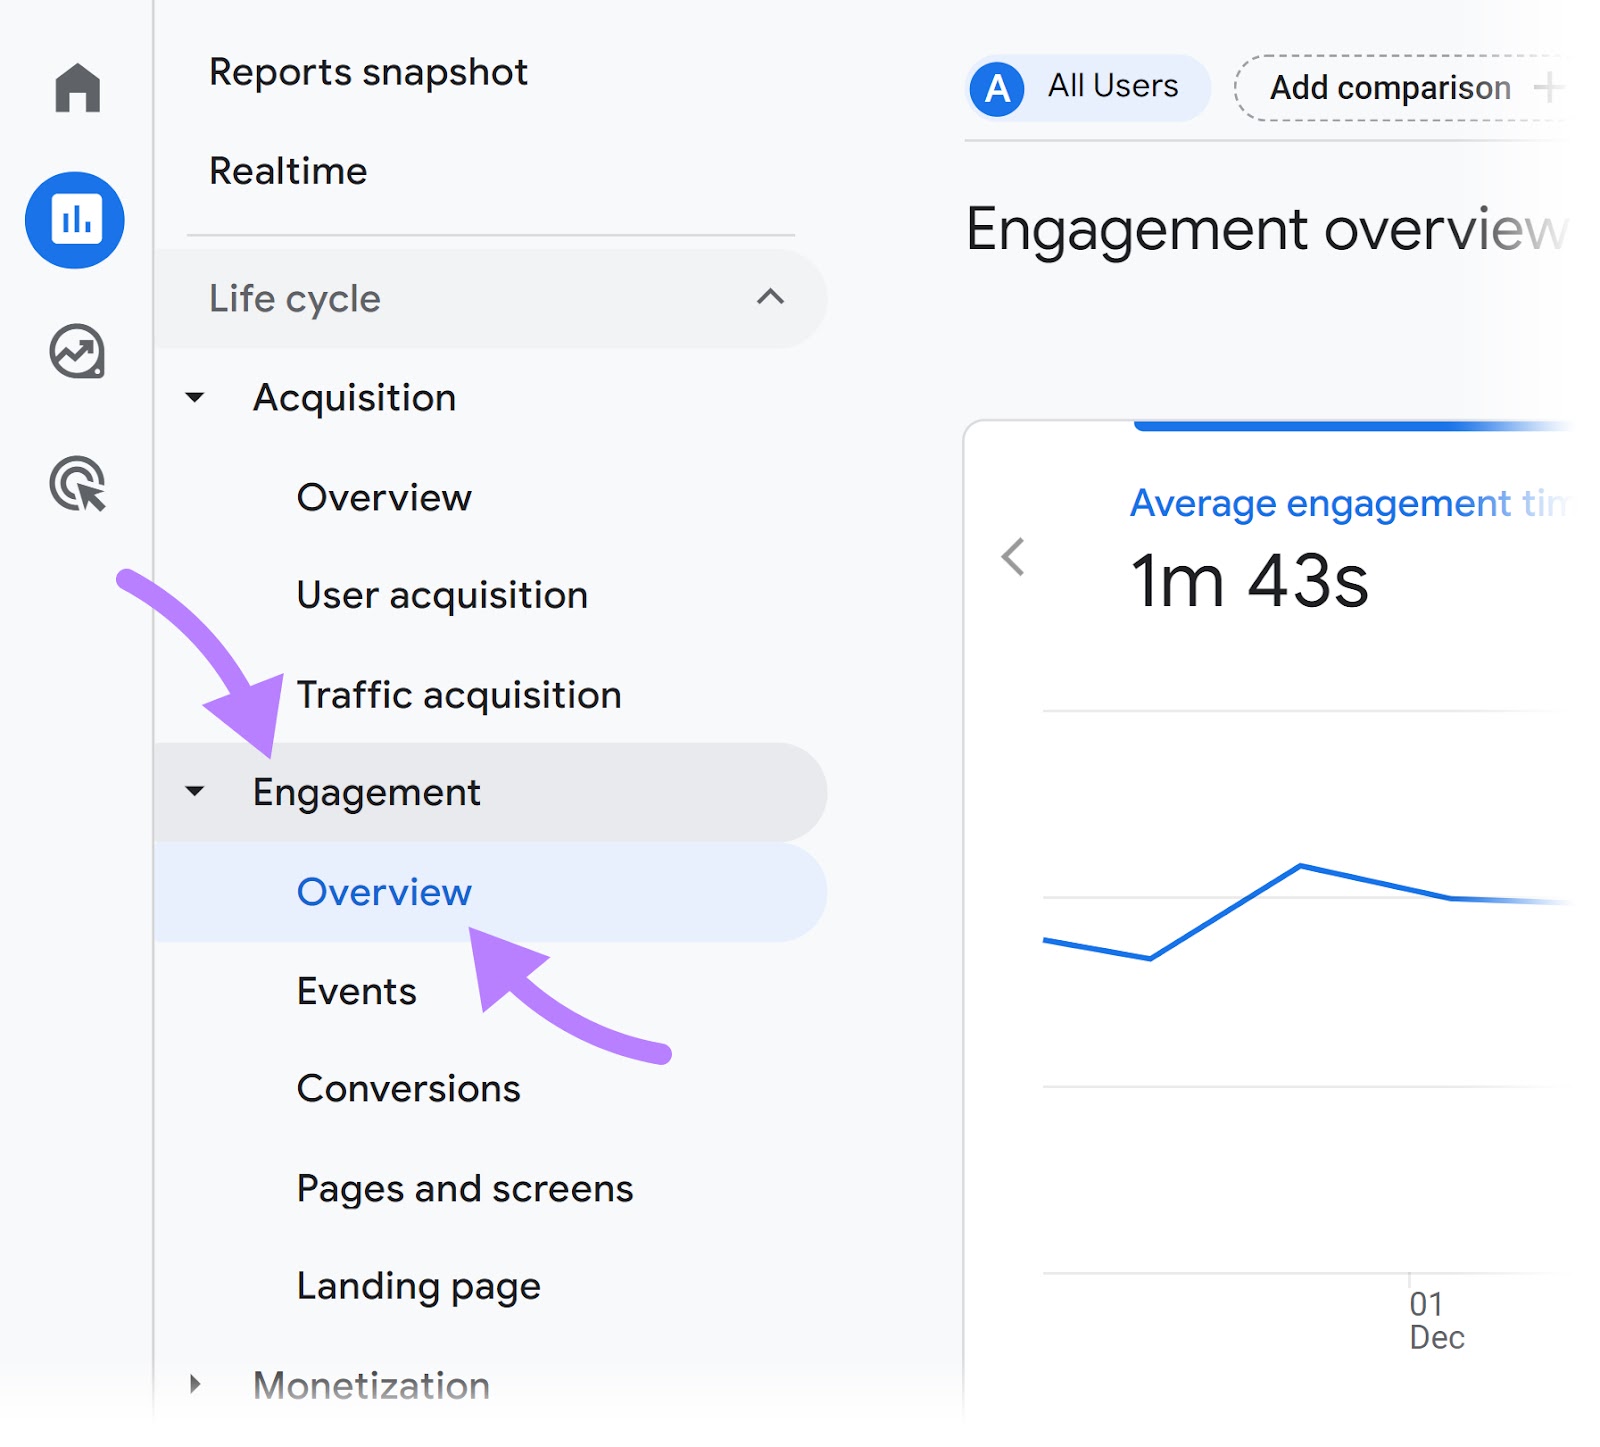
You’ll see average engagement time across your entire website for the specified time frame.
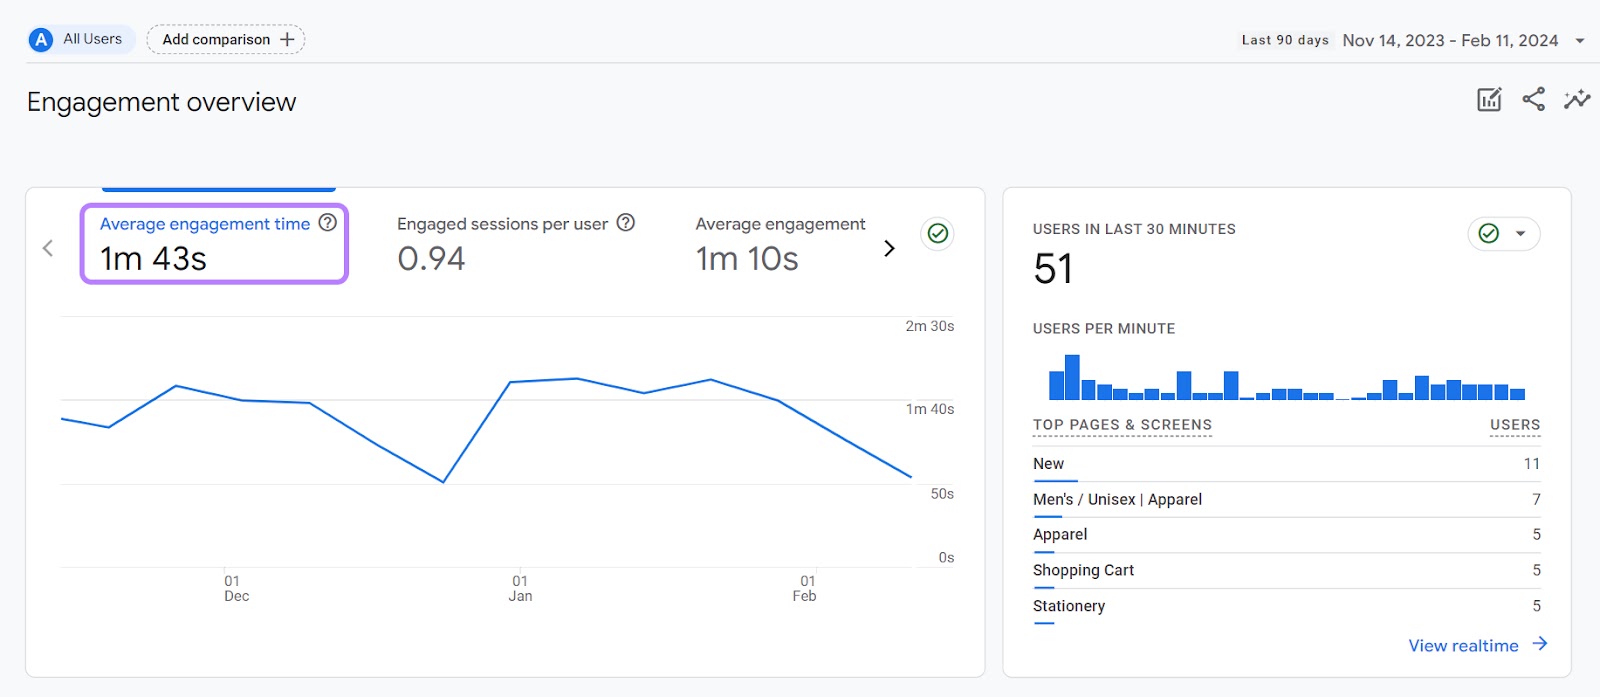
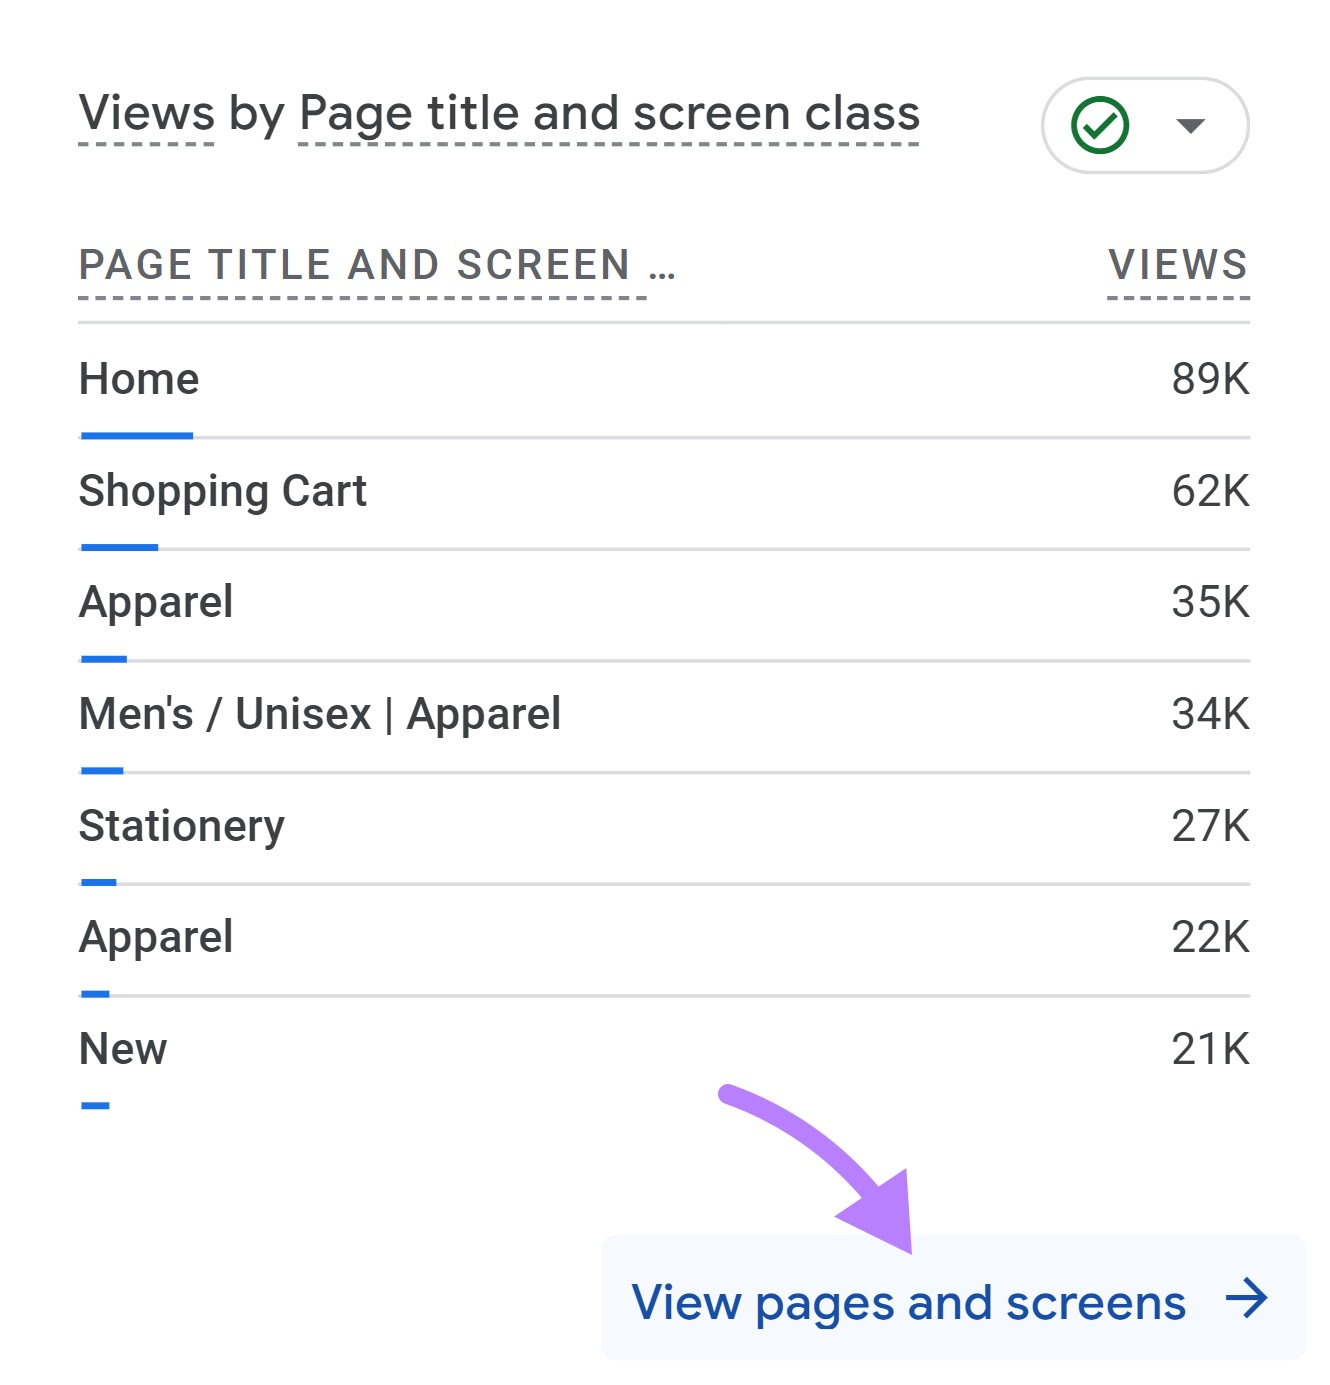
To see numbers for specific pages, scroll down.
Click “View pages and screens” in the “Views by Page title and screen class” section.
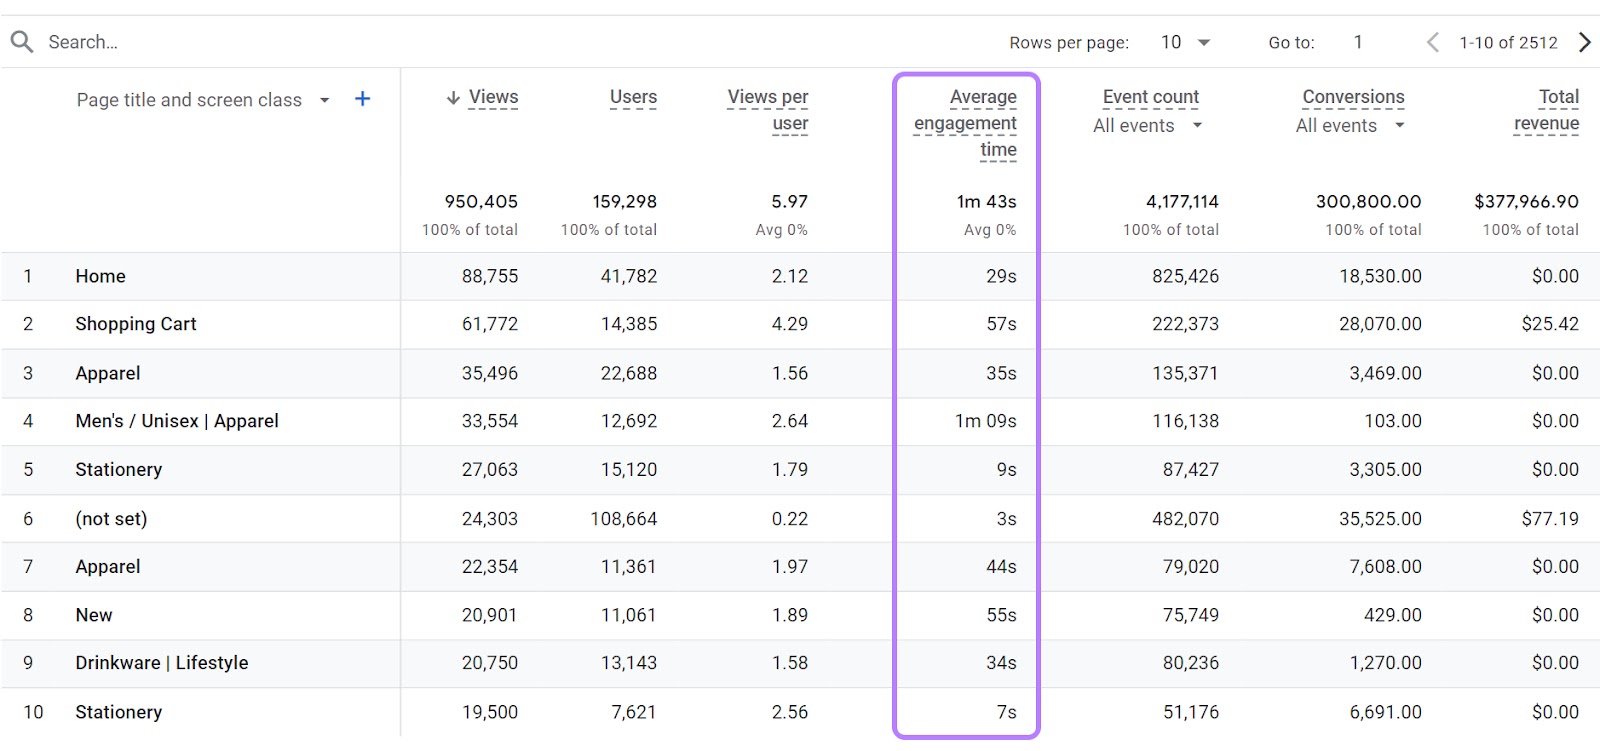
A table showing the pages on your website will open up. The “Average engagement time” column will show you how long active users stayed on your site based on the pages they visited.
Reactions, Shares, and Comments
These metrics refer to how many social media users reacted to (which includes likes), shared, and commented on your content.
By analyzing these metrics across your social content, you’ll learn what kind of posts your audience likes the most.
Keep track of these metrics across several platforms in Semrush Social.
Follow these configuration instructions to connect your Facebook, Instagram, and LinkedIn accounts.
Now, let’s explore engagement metrics for Instagram.
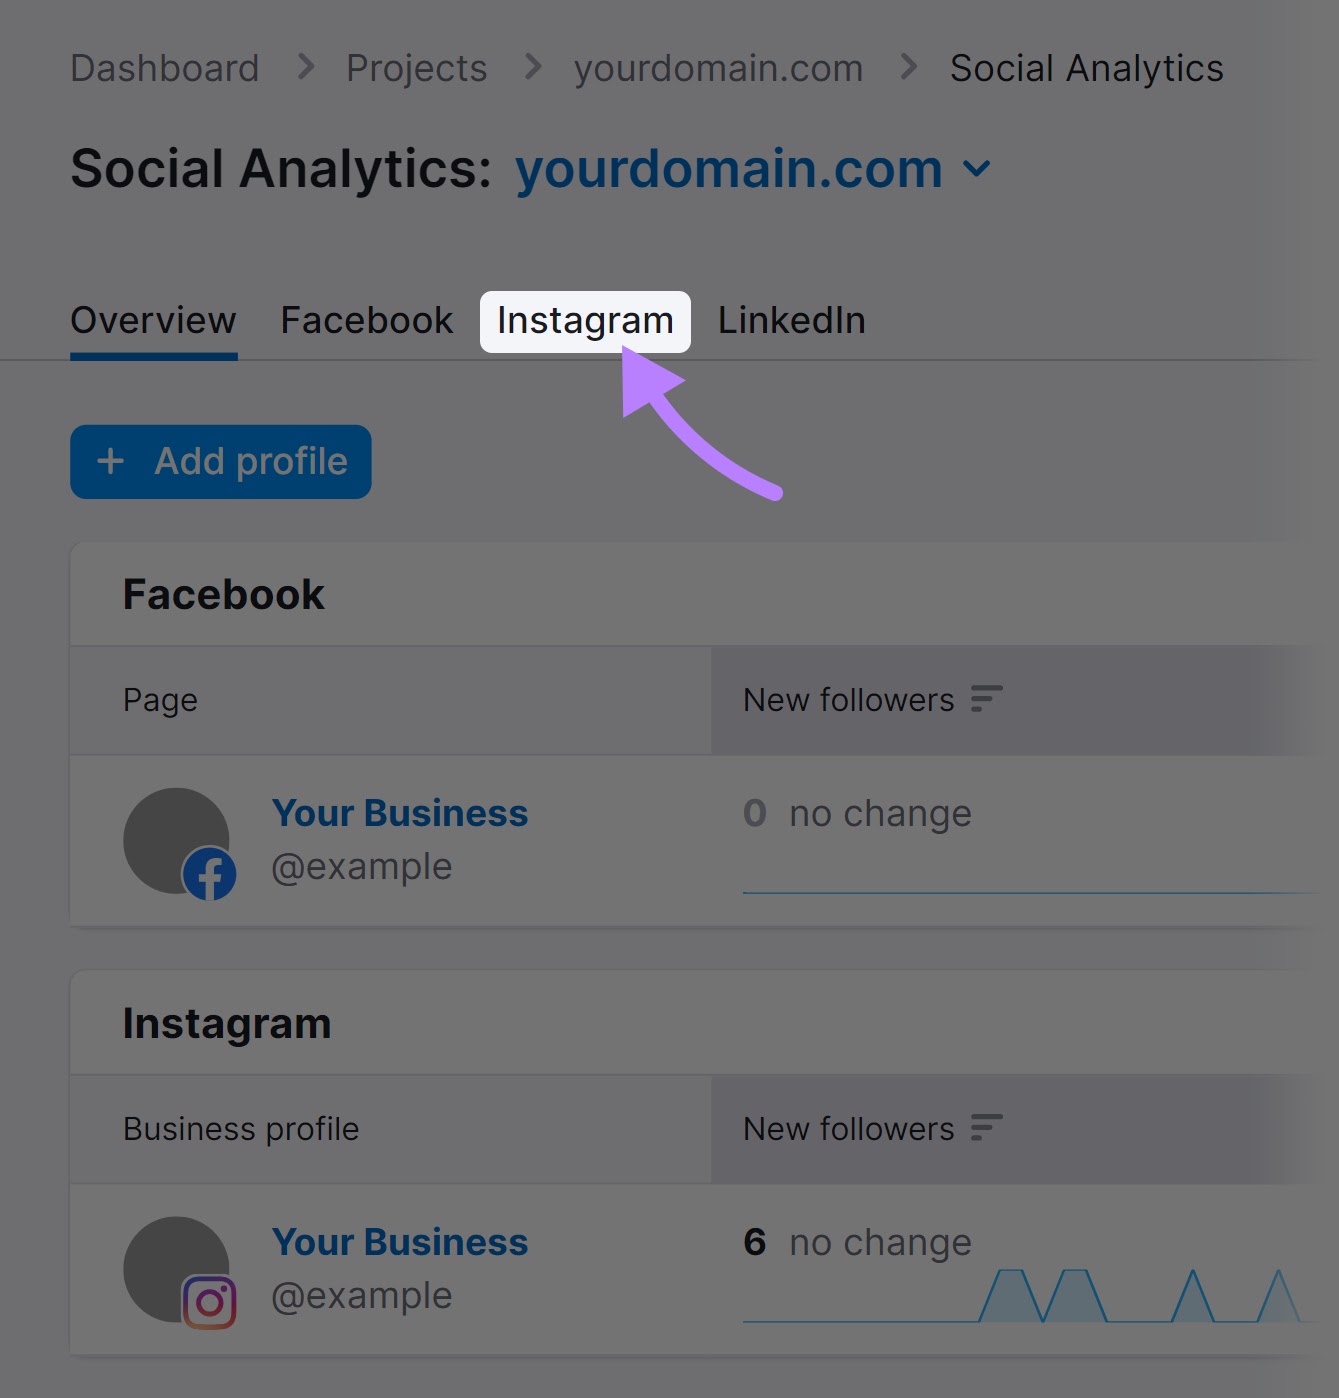
Click on the “Instagram” tab in Social Analytics.
Then, click “Posts” to explore the number of likes, shares, and comments your posts get. And find the best- and worst-performing ones.
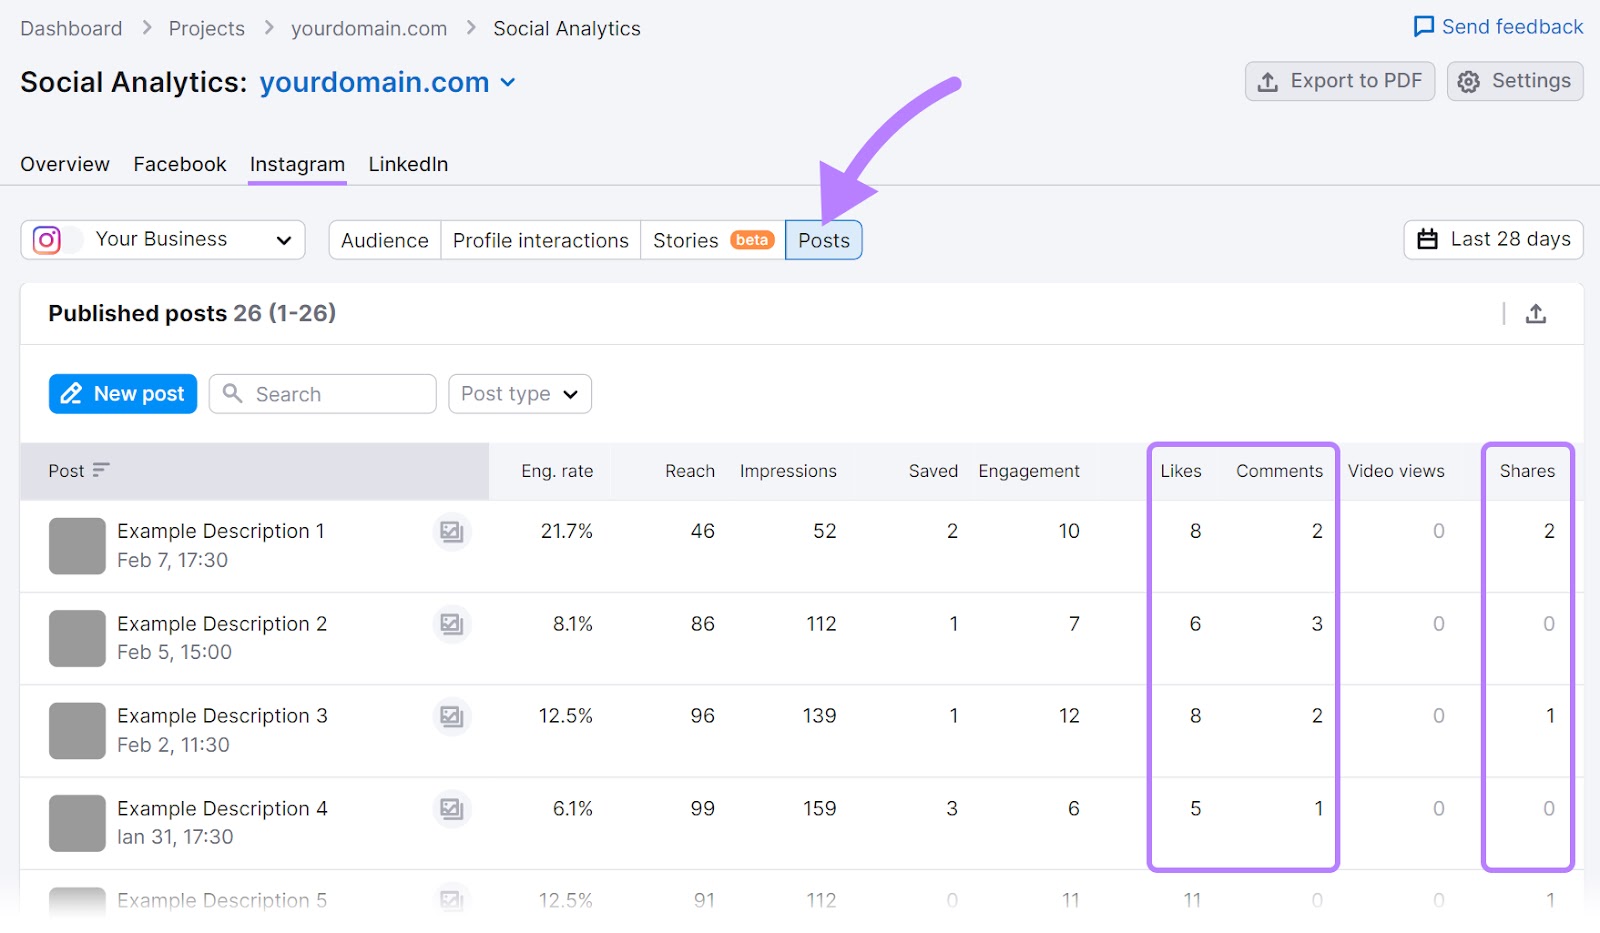
The insights you gain from doing this can inform your future social media content. So you create more of what your audience enjoys.
Create a Content Performance Monitoring Dashboard
Setting up a content performance dashboard will help you keep track of important metrics in a single place.
Semrush’s Organic Traffic Insights tool helps you achieve that by combining data from Google Analytics, Google Search Console (GSC), and Semrush.
To set it up, open the tool, enter your domain name, and click “Get Insights.”

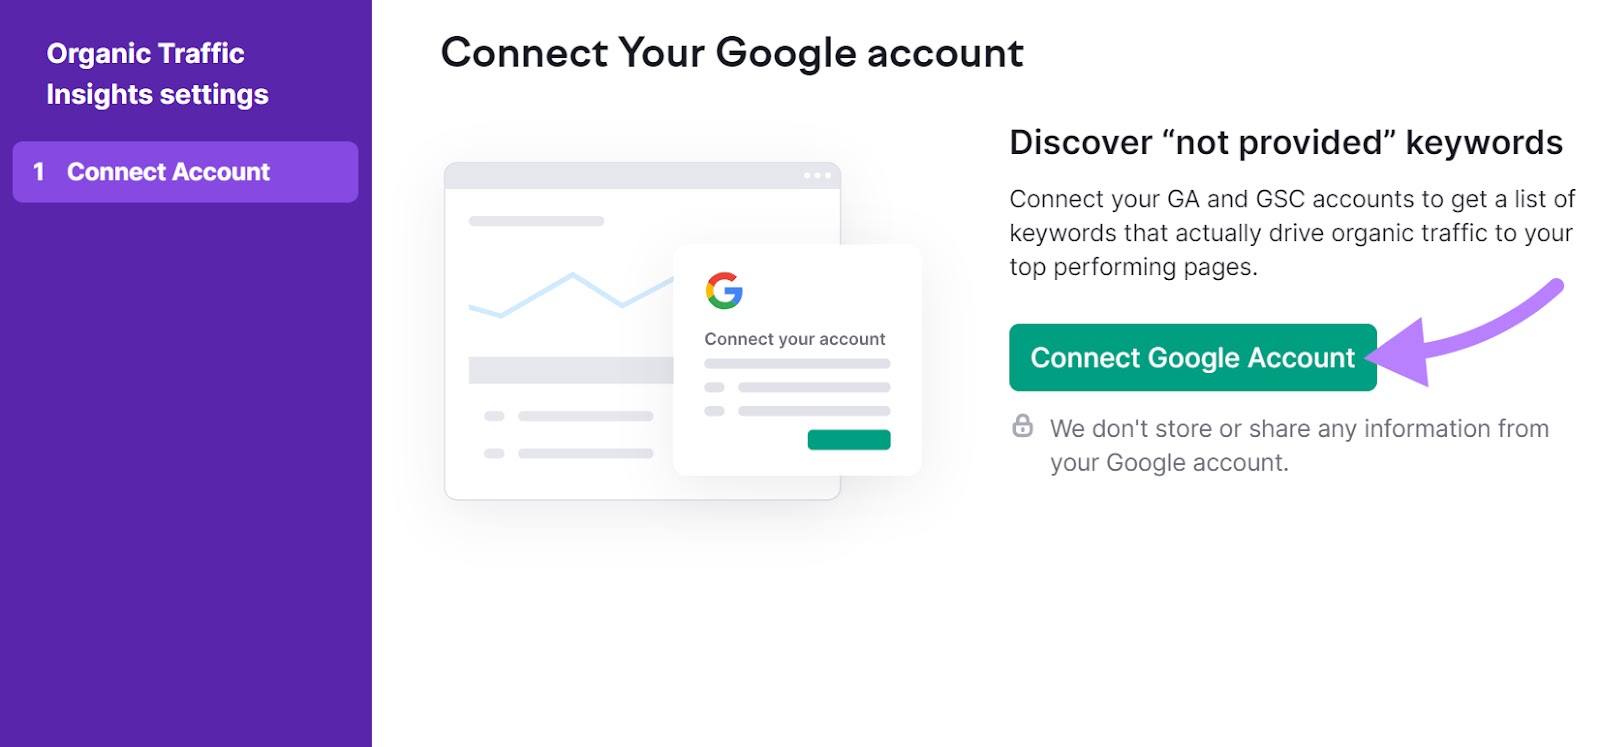
Next, click “Connect Google Account.”
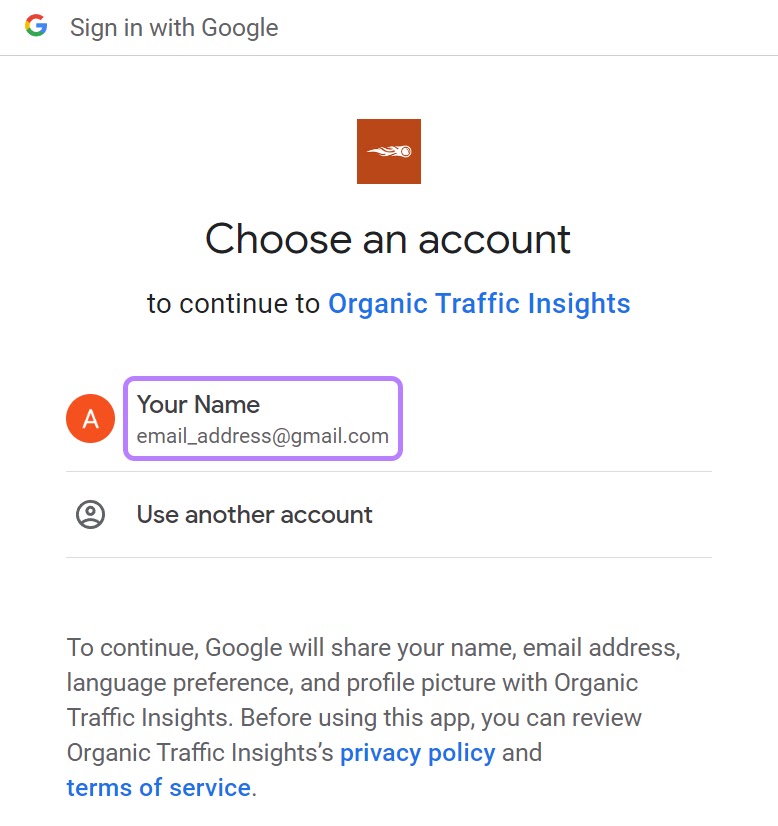
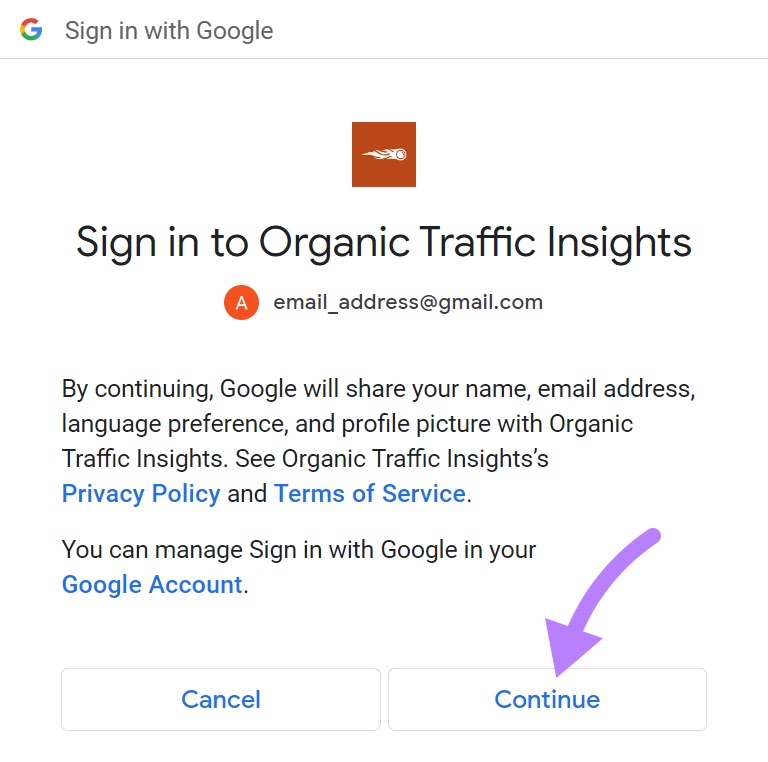
You’ll be taken to a login page where you need to choose an account you want to connect to. This is the email address that’s connected to your GA4 and GSC.
Review the terms and conditions, then click “Continue.”
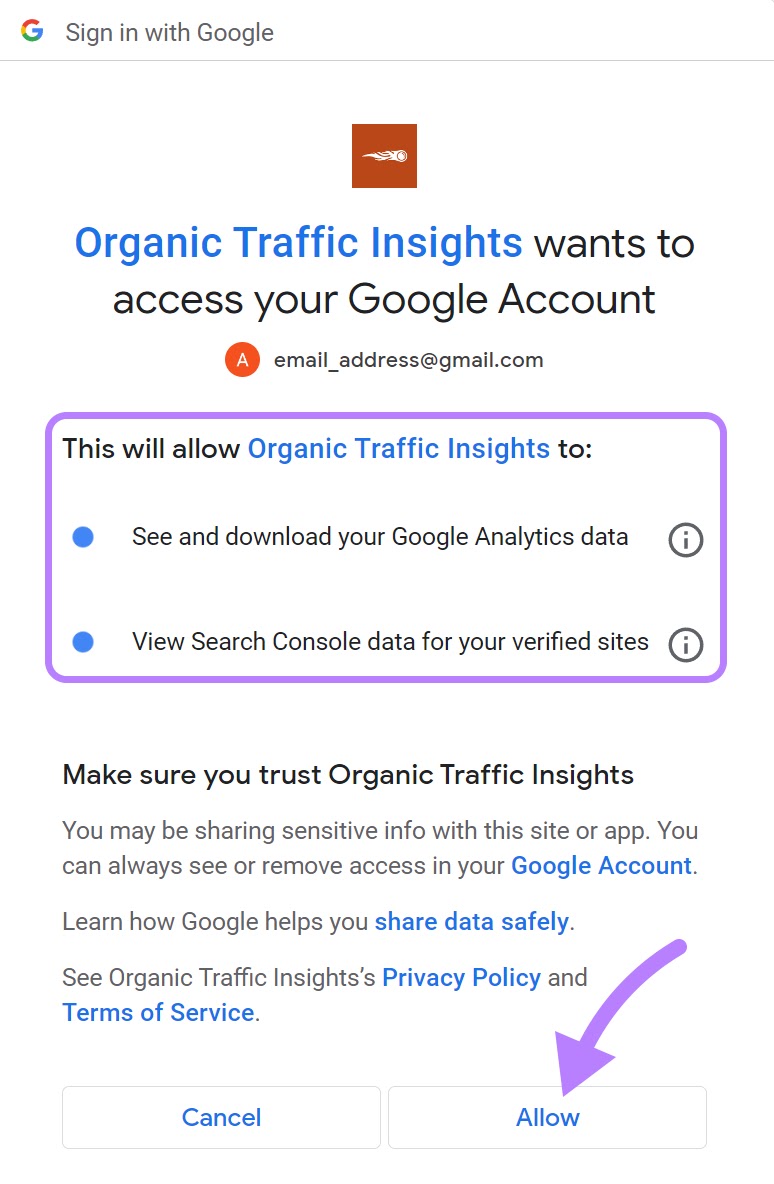
Review the permissions, then click “Allow.”
Next, you’ll be taken back to the Semrush interface. Where you’ll connect your Google Analytics and Google Search Console accounts.
Once setup is complete, you’ll see the metrics from these three sources combined in one dashboard.
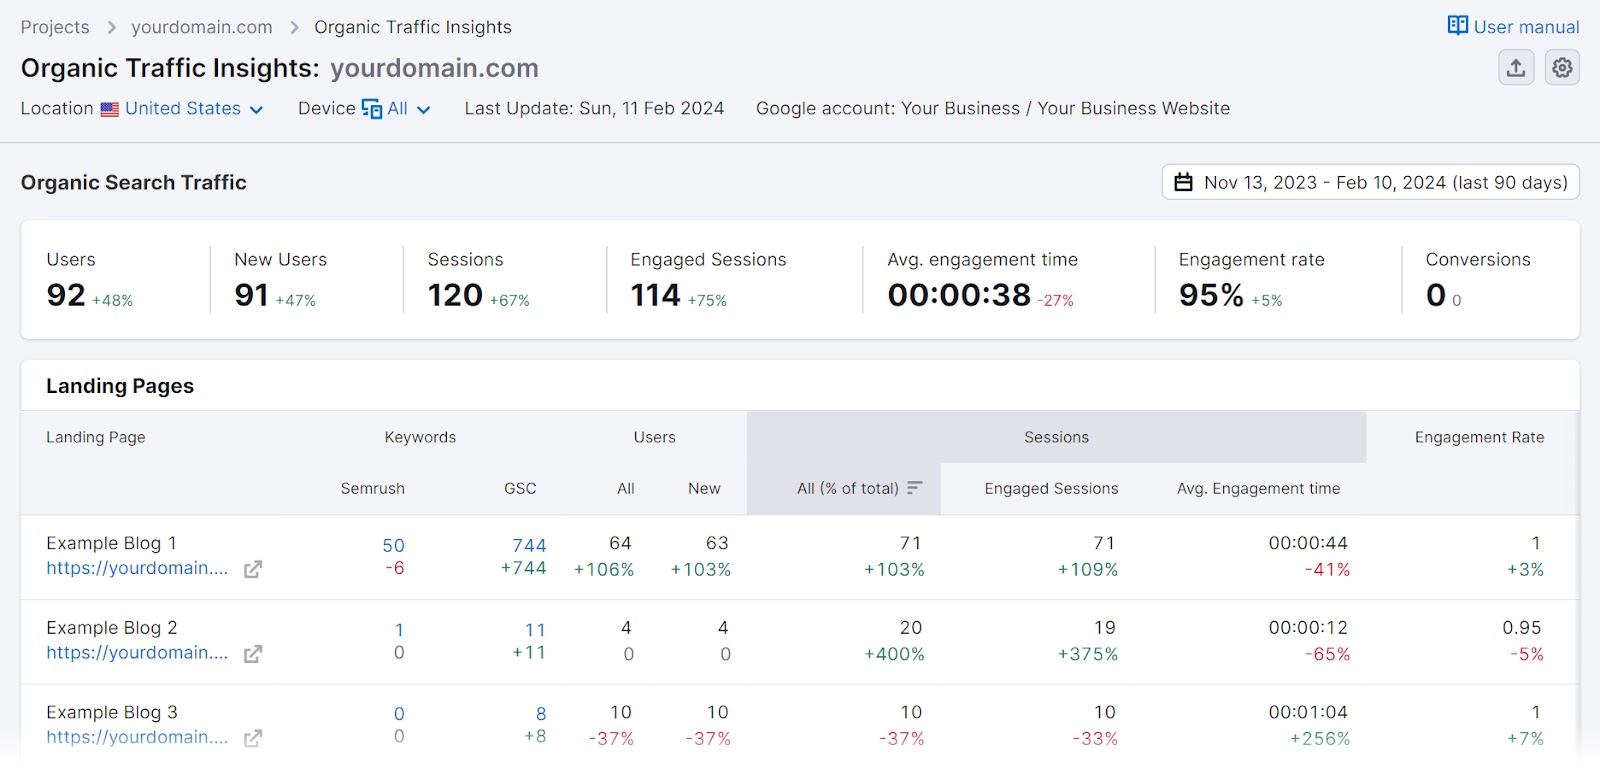
You can see many of the metrics we’ve covered: keyword rankings, users, average engagement time, engagement rate, etc.
And a great feature in this dashboard is the keywords from the Google Search Console.
View a list of all the keywords driving traffic to a particular page by clicking the number in the “GSC” column for the page you want to analyze.
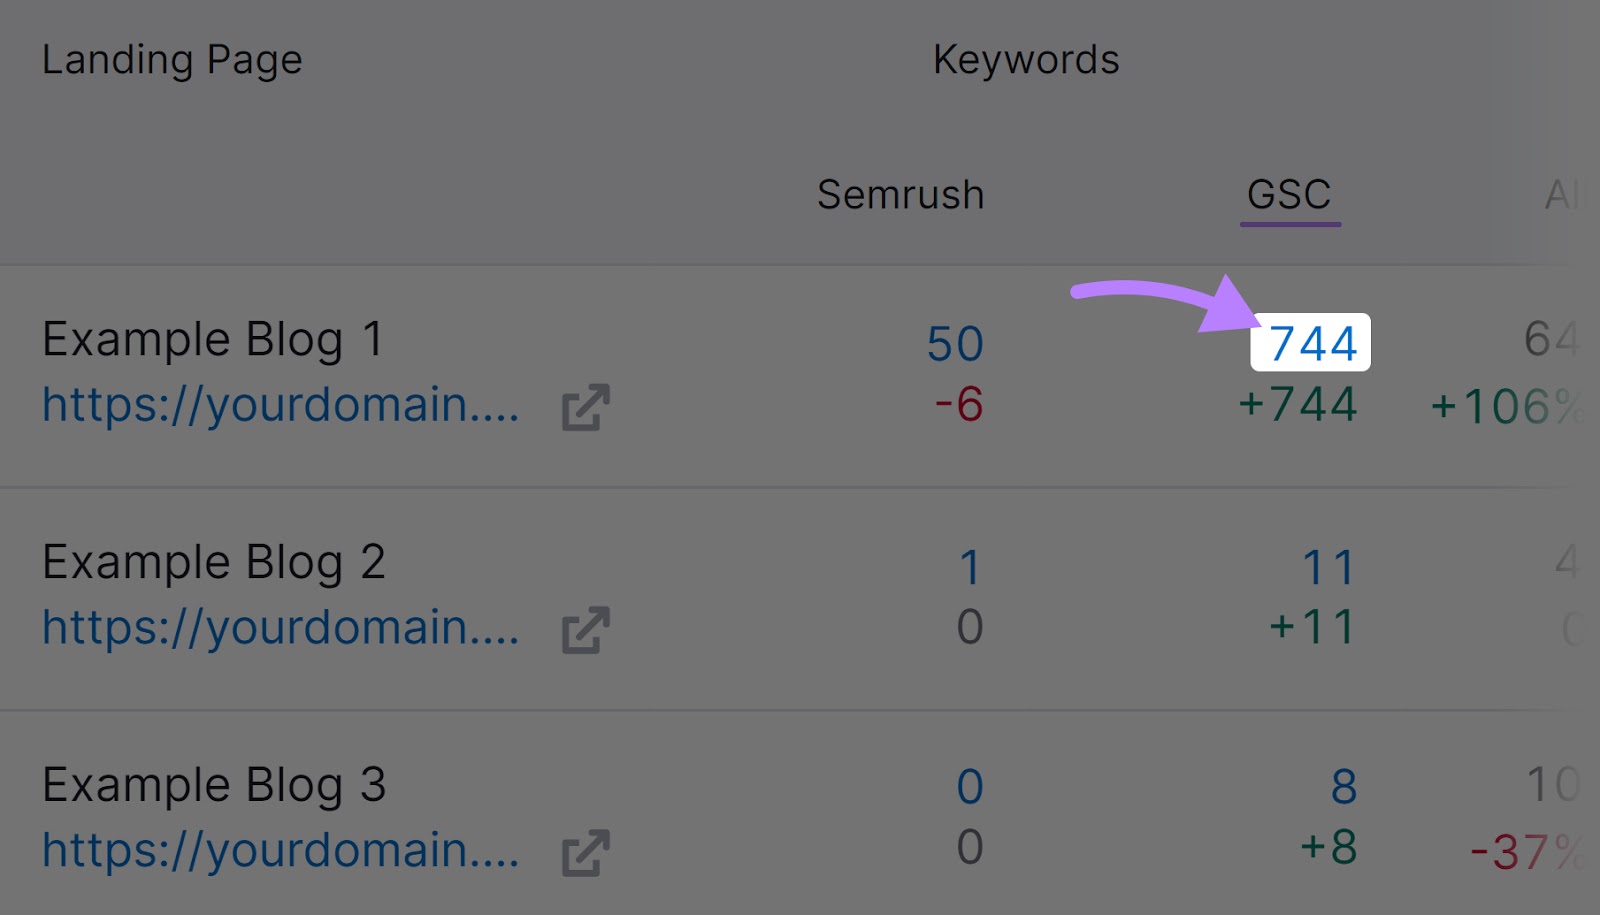
Analyze the search terms you see here.
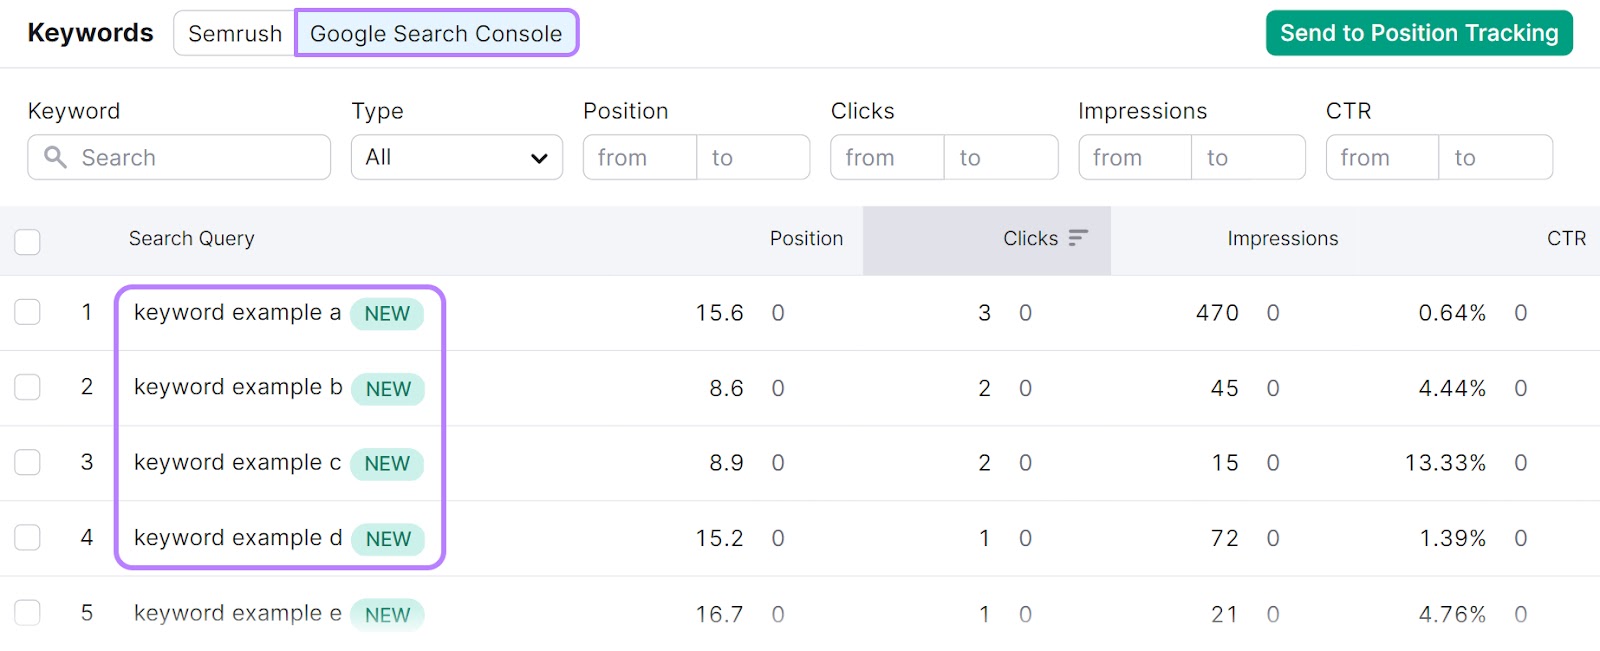
If you notice ones that are relevant but you haven’t targeted, consider adding them to that content when you update it in the future.
You can also see which pages are ranking well but aren’t getting many clicks.
Maybe these pages could perform better if you improve their title tags (HTML that indicates the page title and might show in search results) and meta descriptions (HTML that provides a brief page summary and may show in search results).
Start Measuring Content Performance
Tracking content performance is a key step to understanding your audience, the impact you’re creating, and how to improve.
And tools like Semrush can make the measuring process a lot easier.
Sign up for a free seven-day trial and gain access to:
And a lot more.


